|
|


 Arabic
 Bengali
 Chinese
 English
 French
 German
 Hebrew
 Hindi
Hindi Italian
 Japanese
 Korean
 Malay
Malay Polish
 Portuguese
 Spanish
 Turkish
 Ukrainian
 Vietnamese
|
ENCYCLOPEDIA OF RADIO ELECTRONICS AND ELECTRICAL ENGINEERING What is SSB? Encyclopedia of radio electronics and electrical engineering
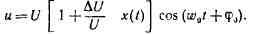
Encyclopedia of radio electronics and electrical engineering / Miscellaneous electronic devices The abbreviated name of single-sideband modulation (SSB), adopted in the amateur radio code, comes from the English Single Side Band, which means one side band. Before proceeding to the consideration of single-sideband modulation, we recall what modulation is in general. At the same time, we will not touch on the methods of its implementation for the time being. Modulation is the process of changing one or more parameters of a given signal under the influence of another signal. The modulated signal usually represents the simplest oscillations, which are described by the expression: u=Ucos(wot+fo), where U is the amplitude; wo=2pfo - angular frequency; fo - initial phase; t - time. The parameters of such a signal are amplitude U, frequency wо (or fo), and phase fo. A low-frequency signal X(t) affecting one of these parameters is called a modulating signal. Depending on which of the parameters is affected by such a signal, there are three types of modulation: amplitude, frequency and phase. To analyze modulated oscillations, we will use three different ideas about the signal: temporal, spectral (frequency) and vector. In accordance with these representations, a cosine (or sinusoidal) oscillation. On fig. 1, and the time t is plotted along the abscissa, and the instantaneous value of the amplitude U is plotted along the ordinate. 1b, the abscissa shows the frequency f=w/2p, the ordinate shows the amplitude. On this graph, a sinusoidal oscillation is depicted as a straight line segment parallel to the y-axis. The length of the segment corresponds to the oscillation amplitude U, and its position on the abscissa corresponds to the frequency fo. In Fig.1, a sinusoidal oscillation is represented as a vector rotating counterclockwise with an angular velocity wo=2pfo=2p/To, where To is the period of oscillation. The length of the vector corresponds to the amplitude U, and the angle fo corresponds to the initial phase at which time counting begins. It should be noted that all three ideas about the modulating signal are completely equivalent. We will use each of these or several views in parallel when it is most appropriate. Let's consider amplitude modulation. In this case, the amplitude U of high-frequency oscillations changes over time in accordance with the transmitted low-frequency signal Um=U+dUx(t), where dU is a constant value characterizing the intensity of the influence of the modulating signal on the amplitude. Substituting the value of the amplitude Um into the first expression, we obtain
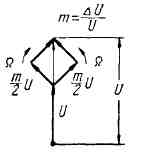
The ratio dU/U=m, which characterizes the modulation depth, is called the modulation factor. If the modulating signal changes according to the law X(t)=cosWt, where W=2pF, F is the frequency of the modulating signal, then, considering the initial phase fo equal to zero, we can write u=U(1+m cosWt)coswot. Opening the brackets and carrying out the transformation, we get
The last equation is the sum of three cosine waveforms, namely the original waveform (excluding phase fo) at frequency fo, or the so-called carrier waveform at fo+F, upper sideband frequency, and the waveform at fo-F, lower sideband frequency. The amplitudes of the lateral oscillations are equal to each other and are proportional to the amplitude of the carrier and the modulation factor. On fig. 2, a shows the time, spectral and vector diagrams of the modulating and modulated signals, as can be seen from fig. 2b, the envelope of the modulated oscillation completely repeats the original signal.
The vector diagram in Fig. 2.e is more convenient to present in a slightly different way. If the observer rotates in the plane of the drawing at the speed of the carrier vector, then this vector will seem stationary to him, and the vectors corresponding to the upper and lower side frequencies will rotate in opposite directions with an angular velocity W. The amplitude of the resulting vector changes in time according to the law of low frequency , and the phase coincides with the phase of the carrier oscillation (Fig. 3).
With frequency and phase modulation, the length of the vector U remains constant. Its position on the plane changes with time. The vector seems to oscillate relative to its original position. The deviation angle df is called the phase deviation. The frequency deviation df from its nominal value fo is called the frequency deviation. The difference between frequency and phase modulation is that with phase modulation, an instantaneous change in the phase angle occurs according to the law of a change in a low-frequency signal, and with frequency modulation, the instantaneous frequency changes according to this law. It is possible to determine whether a given signal is frequency modulated or phase modulated only if the law of change of the low-frequency signal is known. Between both types of modulation there is a well-defined mathematical relationship. In both cases, the vector corresponding to the modulated signal does not rotate around its origin uniformly, but with some variable angular velocity. We considered modulation with one low-frequency signal (one tone). The case of interest is when the modulating signal is not simple harmonic, but more complex, for example, containing three or more frequencies. In this case, we do not talk about side frequencies, but about modulation side bands. When modulated by a speech signal, which is a complex oscillation with a wide frequency spectrum, lower and upper sidebands are formed. If the lowest modulation frequency is Fmin, and the highest is Fmax, then the entire spectrum occupied by the amplitude-modulated signal (AM) will be equal to 2Fmax (Fig. 4).
The study of AM oscillation signals shows that the useful information lies in either of the two modulation sidebands, and the carrier has no useful information. In the transmitter, a significant part of the power is spent on the carrier, which makes AM modulation ineffective. Obviously, to transmit the necessary information, you can limit yourself to transmitting only one of the sidebands. The carrier can be restored at the receiver using a local low-power local oscillator. This will save not only the energy spent on powering the transmitter, but also the frequency band occupied by the signal will be narrowed. There is also some interest in the transmission of two non-carrier sidebands (DSB) and one carrier sideband. Therefore, considering single-sideband modulation (SWM), we will also touch on these types of modulation. On fig. 5 is a frequency diagram of the original spectrum of the re-sung signal, AM, DSB, SSB with carrier and SSB without carrier. A single-sideband signal can be formed while maintaining the relative position of the frequency components of the spectrum, as shown in Fig. 5f and 5d or with spectrum flipping (inversion) (Fig. 5e and 5g). In the first case, the single-sideband signal spectrum is called the upper sideband or normal spectrum, in the second case, the lower sideband or inverted spectrum.
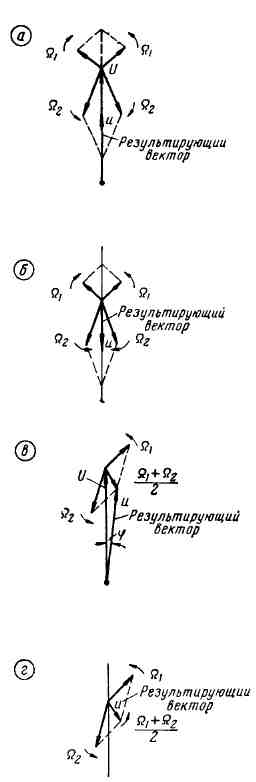
Figure 6 shows vector diagrams of AM, DSB, SSB with carrier and SSB without carrier when modulated with a spectrum consisting of two frequency components W1 and W2. The carrier vector is inhibited. For AM (Fig. 6a) we have a carrier vector and two pairs of vectors corresponding to two upper and two lower side frequencies. The resulting vector is in phase with the carrier vector.
With DSB (Fig. 6b) there is no carrier vector. Therefore, the resulting vector either coincides with the vector of the suppressed carrier, or is directed in the opposite direction, i.e., is shifted in phase by 180 °. The figure shows the case when the resulting vector is just directed in the opposite direction. In Fig. Figure 6c shows a diagram of a single-sideband signal with a carrier. Both components of the upper sideband are represented by two vectors rotating in the same direction with angular velocities W1 and W2. The total vector with angular velocity (W1+W2)/2, adding with the carrier vector, forms the resulting vector v. As can be seen from the graph, this vector “swings” relative to its original position and changes its length. Thus, in the case of single-sideband modulation with a carrier, combined amplitude-frequency modulation takes place. Figure 6d shows a vector diagram of a single-sideband, two-tone signal. The resulting vector in this case is a vector rotating at a speed of (W1+W2)/2 counterclockwise. Since one of the vectors is constantly “catching up” with the other, the amplitude of the resulting vector changes. From this we can also conclude that single-sideband modulation is a combined amplitude-frequency modulation. Research shows that with single-sideband modulation, the amplitude changes according to the law of changes in the instantaneous amplitudes of the modulating signal, and the frequency - according to the law of changes in its instantaneous frequency. A very important practical role is played by the temporal characteristics of the signals discussed above, since they have to be encountered when setting up SSB exciters using an oscilloscope. Therefore, we will first consider in detail the temporal characteristics during modulation with one tone (Fig. 7), and then with two tones (Fig. 8).
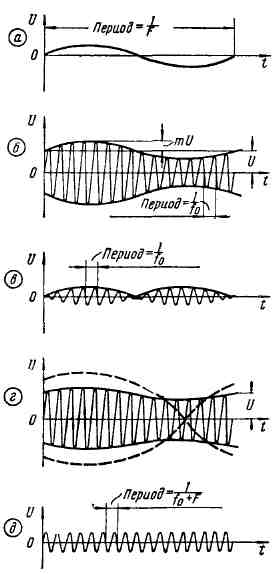
The original sinusoidal low frequency signal is shown in Fig. 7a. The AM signal diagram (Fig. 7b) is easy to build using the vector diagram in Fig.3. The phase of the AM signal envelope coincides with the phase of the original signal during the entire modulation period. Figure 7c shows a diagram of a two-way signal, constructed in accordance with Figure 2, but with a carrier vector equal to zero. Vectors rotating in opposite directions twice in one revolution (per period T = 1/F) are added arithmetically and cancel each other twice. Therefore, the magnitude of the resulting vector changes sinusoidally, and the phase during one half of the period of the modulating signal coincides with the phase of the suppressed carrier, and during the other half it reverses. Since amplitude is a positive quantity, the envelope of a two-way signal without a carrier is a sinusoid, the negative half of which is rotated 180° around the time axis. The high-frequency filling of the oscillogram is an oscillation with a frequency fo, the phase of which is reversed when the modulating voltage passes through zero. Using the same vector diagram of the AM waveform, but discarding one of the vectors corresponding to the sideband, you can easily build a waveform of a single-sideband signal with a carrier. The envelope in this case also does not correspond to the original signal, and the distortion of the envelope will be the greater, the deeper the modulation. The dotted line in the figure shows the envelope at XNUMX% modulation. The duty cycle changes during the low frequency period. Figure 7e shows a diagram of a single-sideband signal without a carrier. The diagram is an ordinary sinusoidal signal, (enveloping straight line), with a constant amplitude, with a frequency of wo+F or wo-F. The deeper the modulation, the greater the amplitude of the signal. Consider the timing diagrams of a two-frequency signal. To simplify the construction, we take two signals with the same amplitude and multiple frequencies F1 and F2=3F1. In Fig. 8a, the solid line shows the modulating signal, which includes oscillations with the indicated frequencies. Figure 8b shows a diagram of an amplitude modulated signal. Its envelope corresponds to the modulating signal.
The diagram of a two-sideband signal without a carrier (Fig. 8c) can be constructed by reasoning in the same way as in the case of a single-frequency signal. During those times when the modulating voltage is positive, the phase of the envelope corresponds to the phase of the modulating voltage, and the phase of the high-frequency fill coincides with the phase of the suppressed carrier. With a negative modulating voltage, the phases of the envelope and high-frequency fill are reversed. The filling frequency in both cases is equal to the carrier frequency f0. The timing diagram of a two-tone single-sideband signal can be constructed and analyzed by referring to the corresponding diagram in Fig. 6. In our case, the vectors rotating at the speed W1=2pF1 and W2=2p(3F1)=3W1 have the same amplitude, so the resulting vector will rotate uniformly at the speed W2=(W1+3W1)/2=2W At the initial moment, when both vectors coincide, the length of the resulting vector will be maximum. Consequently, the amplitude of the envelope will be double the amplitude of each of the high-frequency components. During one revolution of the vector, the angular velocity of which is W1, the vector with the angular velocity W2 = W3 will “catch up” with the first vector twice and will be directed in the opposite direction twice. In accordance with this, the length of the resulting vector during the period T1=1/F will be equal to twice the amplitude of high-frequency oscillations three times and equal to zero twice. The timing diagram for this case is shown in Fig. 8d. The high frequency fill frequency is fo+F3=fo+2F1. It should be noted that in the spectrum of oscillations shown in Fig. 8, there are no oscillations with the “filling” frequency, i.e., with the carrier frequency. Also, the complex oscillation spectrum, the time diagram of which is shown in Fig. 8d, does not contain the frequency component fo+2F. With amplitude detection of the signals discussed above, the output of the detector will have a voltage corresponding to the envelope of high-frequency oscillations. In the case of AM, the envelope repeats the original signal, so the output of the detector will be the modulating original low frequency signal. Detection of a single-sideband carrier signal will also result in a voltage detector output corresponding to the envelope. But, since the envelope itself does not accurately reproduce the modulating signal, the detection product will also be a distorted signal, and the deeper the modulation, the greater the distortion. It is clear that conventional DSB or SSB detection will produce only distortion. For example, when modulated with a single F tone, DSB detection will result in a 2F1 signal and its harmonics, while SSB detection will only produce a DC component. DSB and SSB detection, as noted above, is performed using a local oscillator that restores the carrier. It is interesting to note that the carrier frequency recovery in the case of DSB must be performed with an accuracy of phase (unless, of course, the receiver passes both sides). Otherwise, unwanted phenomena appear. The detection process is illustrated by a vector diagram (Fig. 9), in which the restored carrier differs in phase from the suppressed carrier by some angle f. At the same time, the change in the length of the total vector becomes smaller, as a result of which the detection effect decreases. When the phase is shifted by an angle f=90°, amplitude detection will not give any low-frequency voltage at the output.
Detection of SSB with a carrier recovered in the receiver is in principle no different from detection of a single-sideband signal with an unsuppressed carrier. However, the shape of the output signal (envelope) in this case, as was clarified above, is influenced by the relationship between the amplitude of the local oscillator signal and the amplitude of the detected signal. Obviously, distortion will be insignificant when the amplitude of the local oscillator voltage is many times greater than the amplitude of the detected signal. This can be verified by considering the timing diagram of a single-sideband signal with an unsuppressed carrier (Fig. 7d). Author: L. Labutin (UA3CR); Publication: N. Bolshakov, rf.atnn.ru
Traffic noise delays the growth of chicks
06.05.2024 Wireless speaker Samsung Music Frame HW-LS60D
06.05.2024 A New Way to Control and Manipulate Optical Signals
05.05.2024
▪ Spiders, feeding on graphene, weave the strongest web ▪ New multi-standard TV audio processors and audio demodulators ▪ High Voltage 800W Laboratory Power Supplies TDK-Lambda
▪ section of the site Winged words, phraseological units. Selection of articles ▪ article Manual and automatic white balance. video art ▪ Botany article. Big encyclopedia for children and adults ▪ Plasterer's article. Job description ▪ article Ballast control microcircuits. Encyclopedia of radio electronics and electrical engineering ▪ article Double lift (two ways). Focus Secret
Comments on the article: Georgy How will a low-frequency signal without a carrier pass through the air? After all, a low-frequency signal does not pass through the air
Home page | Library | Articles | Website map | Site Reviews
www.diagram.com.ua |


 Leave your comment on this article: