|
|


 Arabic
 Bengali
 Chinese
 English
 French
 German
 Hebrew
 Hindi
Hindi Italian
 Japanese
 Korean
 Malay
Malay Polish
 Portuguese
 Spanish
 Turkish
 Ukrainian
 Vietnamese
|
ENCYCLOPEDIA OF RADIO ELECTRONICS AND ELECTRICAL ENGINEERING Baffle-Step (wave interference) - an obstacle on the way to linear acoustics. Encyclopedia of radio electronics and electrical engineering
Encyclopedia of radio electronics and electrical engineering / Speakers To begin with, what is Baffle step. This is the phenomenon of interference of waves reflected from the front panel of the speaker system and waves emitted by the speaker located on this panel. This phenomenon occurs in the frequency range determined from below by the dimensions of the emitter and the front panel, and from above by the transition of the speaker from the piston mode to the zonal mode, that is, when the wavelength becomes less than the emitter itself. Of course, the lower limit is valid for closed designs. With the open, everything is much more complicated. What promises the neglect of the "buffle step". At best, an increase in the unevenness of the frequency response. At worst, this unevenness can reach peaks and dips in the frequency response with relative levels of more than 6-7 dB, and the spectrum will be supplemented with longer parasitic resonances. Without a doubt, neither one nor the second has a positive effect on the sound. How the influence of the "buffle step" looks in a graphical form, or otherwise - how it is reflected in the qualitative characteristics. Let's take an example from the LspCAD 6 package with D'Appolito's optimized two-way speaker system. Initially, the frequency response of the optimized system is as follows:
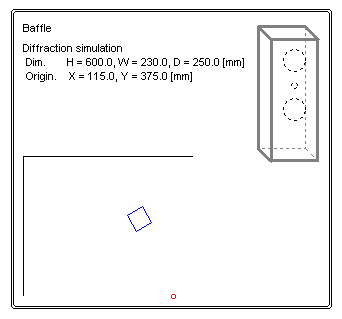
I completed the system with a case with the following data:
Turn on the baffle simulation:
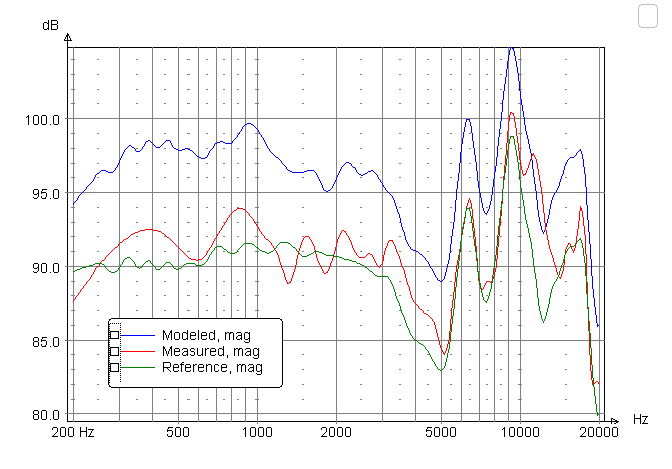
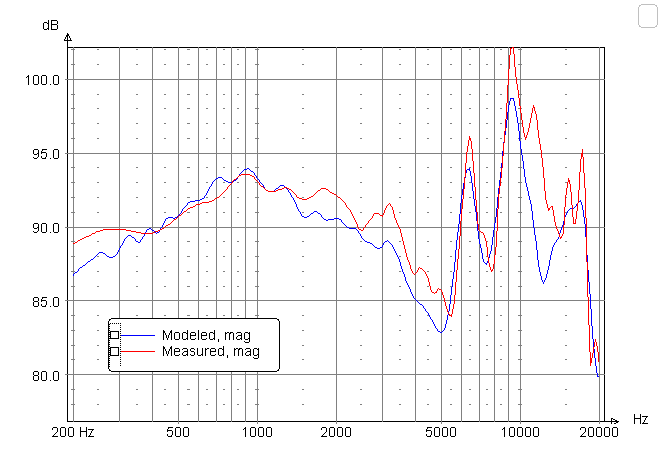
Now the overall frequency response is +/-2.5 dB in the frequency range of 300 Hz - 20 kHz. It seems that the unevenness is not great, but the initial one is +/-1.5 dB in the frequency range of 100 Hz - 20 kHz, that is, initially the characteristic is very well aligned. Yes, and the location of the speakers is clearly successful. And what will happen if the optimization was not performed and the original linearity of the frequency response leaves much to be desired, or, even worse, already has unevenness in the frequency region where the "buffle step" will make the most significant corrections? A reasonable question is: do the simulation results correspond to the real behavior of the speaker, because for the design of a linear speaker, the "baffle" must be taken into account? I asked this question and got the answer. My results of the "buffle step" experiment are small, but they are indicative. So how did it happen. I used as standard what was at hand. This is a woofer / midrange speaker with a nominal diameter of 4.5 inches (the useful diameter is indicated; the outer diameter of the "basket" is 150 mm) and a metal cone, which is why the measurement graphs contain frequency response emissions in the upper part of the audio frequency range. The second "experimental" - 4A28, which, like the 4.5 inch speaker, turned out to be useful to me when simulating the operation of speakers in open space conditions (Free-Air design), but 4A28 did not participate in the experiment with "buffle step" due to the lack suitable acoustic screen. In order to have a starting point, the speaker was measured in the near field (10 cm from the driver) when installed in a regular location of the speaker system. This design is a FI with a volume of 12 liters, but in this case the port was closed. Measurements in the near field make it possible to largely get rid of the "baffle" effect and, in the case of a SP, completely eliminate the ACD. After that, the speaker was placed in the center of the acoustic shield, which is a shield 315 mm wide and 840 mm high. The measurements were carried out from a distance of 70 cm from the emitter and, together with the results of measurements in the near field of the GC, were placed into the LspCAD program. The project used three emitters and the "Diffraction Simulation" tool, simulating the "buffle step". The dimensions of the "baffle" correspond to the dimensions of the shield, the position of the speaker is similar to the position in the shield, that is, in the center, the diameter of the emitter is 110 mm, as in reality. The distance to the emitter is also set similarly to real measurements - 70 cm. Since my measuring complex allows measurements with absolute values of sound pressure, the frequency response when measured at a distance other than 1 m was corrected by shifting along the vertical scale, taking into account the logarithm of the voltage ratio. Simply put, on all graphs, the results of measurements of the frequency response are given to the values obtained from a distance of 1 m with a voltage of 2.828 v supplied to the speaker independently from its nominal resistance. Why LspCAD uses three emitters. The first one is "reference". It displays the frequency response without the influence of "buffle step". The second one is the result of real measurements from a distance of 70 cm. The third one is the simulation of "buffle step" based on the frequency response of the "reference" radiator. The result of modeling in LspCAD:
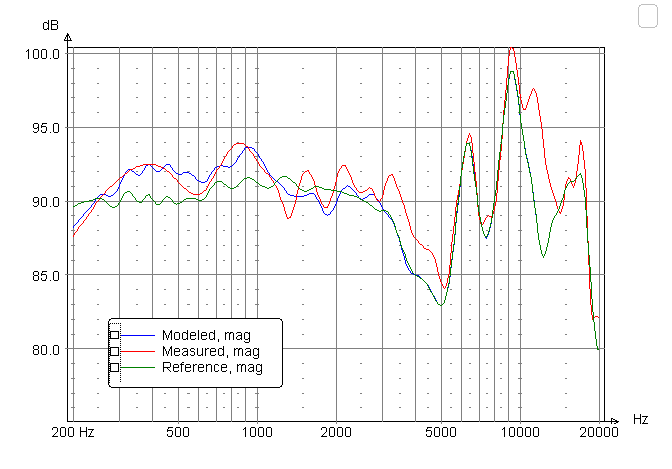
Below the curves are signed: Reference - "reference" emitter; Measured - the result of real measurements and Modeled - the result of simulation. I can't tell why LspCAD shifted the simulated frequency response up - in reality it doesn't. Shifted by exactly 6 dB, which I found out by selecting the generator voltage value for the simulated speaker. I shift the frequency response down by 6 dB:
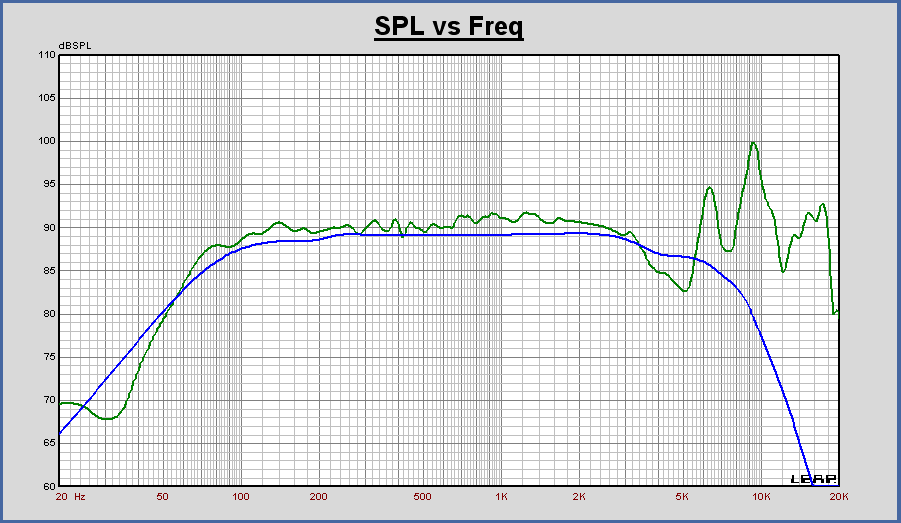
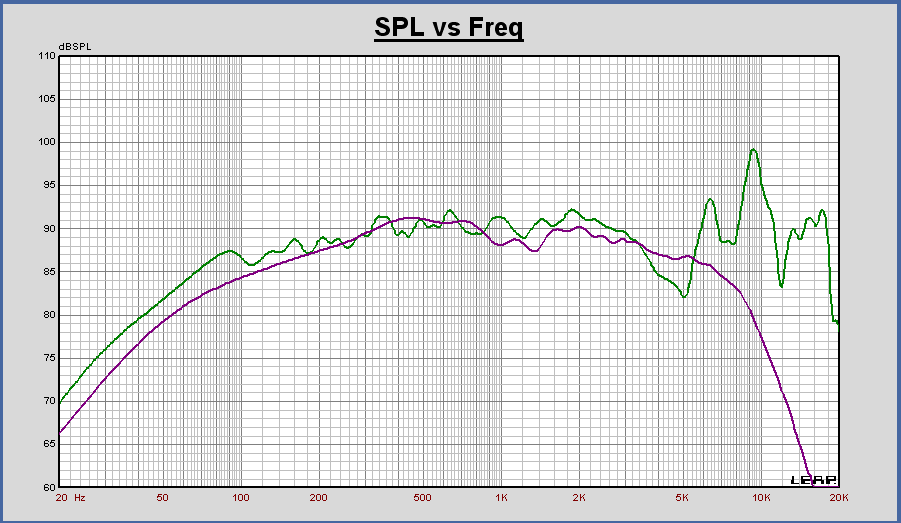
As can be seen, the agreement between the simulation results and real measurements is quite good. What exactly LspCAD is guided by when the frequency response is shifted up by 6 dB is not clear to me personally. I stopped using this program, and carried out further comparisons in a more serious CAD system - LEAP. The latter, as it turned out, does not suffer from such "peculiarities" and, moreover, allows one to simulate dynamics under various conditions, up to radiation in free space. For modeling in LEAP, the Thiel-Small parameters of both drivers (4.5" woofer/midrange and 8" 4A28) were entered into the software database. Comparison of the results of measurements in the near field of the woofer / midrange speaker, when installed in a regular place of the speaker, and its simulation, taking into account the location in the OC of a similar volume, without taking into account the "buffle step" is given below:
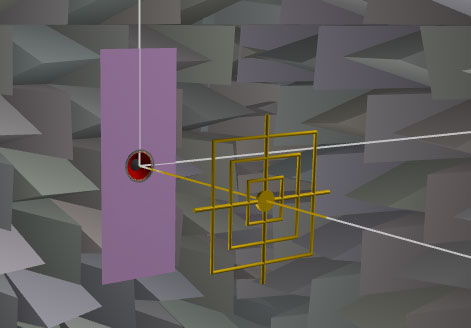
On all the graphs that I will give, the blue curve corresponds to the simulation in an infinite screen (without the "buffle"), the purple one (will be later) - to the simulation in open space conditions (taking into account the "buffle"), and the green one - to real measurements. In the above graph, the average sound pressure of the simulated speaker, built on the Thiel-Small parameters alone, is 1.5 dB lower than the real one. This is a very good result. This simulation was carried out with the following arrangement of objects:
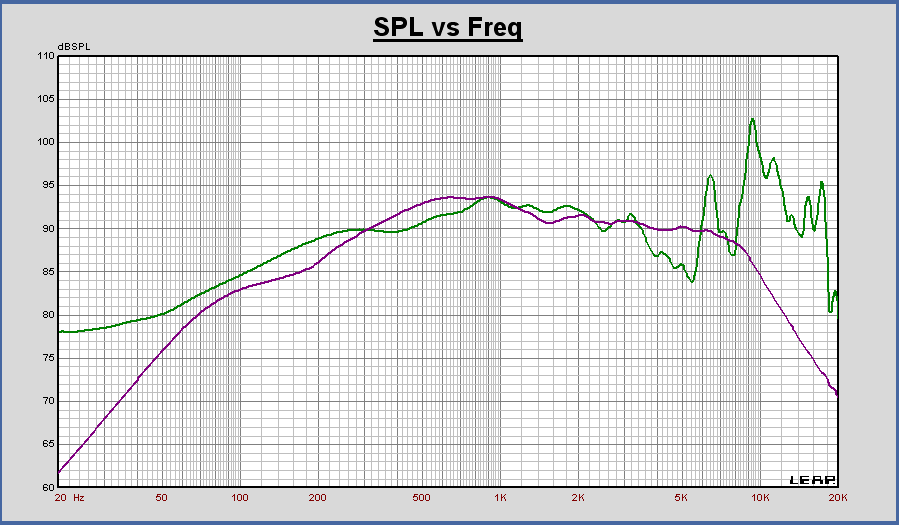
Modeling without taking into account the "buffle step" requires specifying the infinite screen method. This results in displaying the appropriate speaker front panel design. Next, the result of measurements of the speaker in the shield from a distance of 70 cm was imported into the program and the simulation was launched under conditions similar to the real ones:
The result of the comparison of the frequency response:
Similarly, for a distance to the emitter of 10 cm:
As can be seen, the simulation and real measurements agree quite well. And if you add the missing 1.5 dB, by which LEAP underestimates the average sensitivity of the simulated speaker, the match is even better. An example of modeling in LEAP a "buffle step" box, in which the manufacturer installed this woofer / midrange speaker as a midrange link, taking into account the correction of +1.5 dB:
Similarly in LspCAD 6:
The goal of my little experiment has been achieved. "Buffle step" is perfectly modeled by specialized "software", and its influence on the final frequency response cannot be underestimated. Since LEAP is able to simulate the behavior of speakers in open space, I did not neglect the opportunity to check the accuracy of the simulation:
Why did this interest me? I once told in one of the topics about the previously incomprehensible behavior of the speaker outside the regular box, when the frequency response in the operating frequency range in the box fits into the unevenness of +/-1.5 dB, and outside the box (that is, in the design of Free-Air ) is +/-7.5 dB with a pronounced peak in the frequency response in the midrange region. Comparison results from a distance of 10 cm from the emitter:
This is the same speaker that was measured in the shield. Beautiful! The comparison results for the 4A28 speaker in Free-Air design from a distance of 30 and 10 cm from the radiator are shown below:
What can be said. Firstly, which is not a discovery, the speaker before the transition to the zonal mode has a directivity close to circular, so the ACZ manifests itself in full just to this area. Secondly, for some reason I immediately remembered attempts to compare two speakers by ear, naturally, without design, to evaluate its sensitivity, frequency response linearity, and sometimes even give specific numbers. Look at the charts. In the region of the greatest sensitivity of hearing, the radiation nonlinearities are fully manifested. Not only does the change in the frequency response manifest itself with a change in the distance to the emitter, it depends on the diameter of the emitter. And according to the results of measurements, taking into account the "buffle step", we can say the following. Two completely identical speakers, being installed in different acoustic designs, or installed on speaker front panels of different sizes, or differently placed on the same speaker front panels, or all of this together plus a different nominal size of the radiators - all this will provide in each specific case specific speaker behavior. Author: Lexus (Sirvutis Alexey Romasovich); Publication: cxem.net
Artificial leather for touch emulation
15.04.2024 Petgugu Global cat litter
15.04.2024 The attractiveness of caring men
14.04.2024
▪ Fungal extract against cancer ▪ Medical DC/DC Converters Mean Well MDS15/20 ▪ Yamaha SR-C30A soundbar with compact wireless subwoofer
▪ section of the site Normative documentation on labor protection. Article selection ▪ article The state of the biosphere and human health. Basics of safe life ▪ article Is it true that the Egyptian pyramids were built by slaves? Detailed answer ▪ article Loading and unloading of viscous oil products. Standard instruction on labor protection ▪ article Miracle gun. Focus Secret
Home page | Library | Articles | Website map | Site Reviews
www.diagram.com.ua |


 Leave your comment on this article: