|
|


 Arabic
 Bengali
 Chinese
 English
 French
 German
 Hebrew
 Hindi
Hindi Italian
 Japanese
 Korean
 Malay
Malay Polish
 Portuguese
 Spanish
 Turkish
 Ukrainian
 Vietnamese
|
ENCYCLOPEDIA OF RADIO ELECTRONICS AND ELECTRICAL ENGINEERING Transfer function: how to measure? Encyclopedia of radio electronics and electrical engineering
Encyclopedia of radio electronics and electrical engineering / Speakers Experienced installers are well aware that the sound of a subwoofer speaker depends largely on the parameters of the cabinet in which it works. As a rule, the required characteristics (Thiel-Small parameters) are indicated in the accompanying documents of the bass head, and various computer programs currently available allow modeling a box of the theoretically optimal type and volume. For the practical implementation of the plan, one more factor should be taken into account, namely the transfer function of the cabin of a particular car.
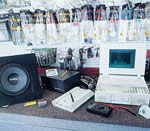
1) Necessary tools: test subwoofer, spectrum analyzer, amplifier, tape measure, digital voltmeter, etc.
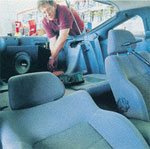
2) The test subwoofer is installed in the cargo area, and the microphone is located at the driver's headrest,
3) The distance from the speaker to the microphone should be carefully measured First, some background information. Computer software, of course, facilitates the work of installers, but not to such an extent as to rely entirely on it. In principle, various programs for calculating subwoofer cabinets that have appeared recently are quite accurate in predicting the frequency response of a bass driver. However, the frequency response curve obtained with the help of electronic intelligence refers to open space, and not to the car interior, where, in fact, the subwoofer will have to work. At the same time, a woofer "dressed" in some type of enclosure in a Volkswagen Beetle sounds very different from being located in the center circle of a football field. Furthermore. The same subwoofer plays differently in different cars. For example, a subwoofer, which has excellent frequency in a huge Ford Explorer, will work very badly in the trunk of a mid-size Nissan Primera. Those who have already got their hands on subwoofer building or at least once tried, at the request of the customer (or even for the sake of experiment), without further ado to transfer the cased low-frequency speaker from one car to another, are well aware of this. Why is this happening? Here, too, there are no special secrets: small enclosed spaces affect the propagation of sound waves. And the smaller the space, the greater the impact, which mainly comes down to a rise in the low frequencies, which does not always have a beneficial effect on the sound of the entire audio complex. That is why it is necessary to take into account the transfer function of each particular vehicle interior. Moreover, most of the clients of installation centers for some reason, first of all, demand "good bass", not always, however, fully understanding what is behind the word "good". So, the transfer function is the effect that the acoustic conditions of the car interior have on the frequency response. Since subwoofers almost always play up to 200 Hz (and in this material we analyze only the problems that arise with the bass component of the frequency spectrum), anything higher does not interest us. Of course, there is no universal formula for calculating the transfer function, and each specific case has to be analyzed empirically. What is needed for this? In order of listing: spectrum analyzer (RTA); microphone; digital voltmeter; a test disk with fragments of pink noise recorded on it; amplifier; test subwoofer in a closed case; roulette; paper; pencil. The calculation of the cabin transfer function is reduced to three operations: 1). Measurements of the frequency response of the subwoofer inside the vehicle; 2). Measurements of the frequency response of a subwoofer in open space at the same signal level and at the same distance from the microphone as in the first case; 3). Subtraction of the frequency response obtained in open space from the frequency response obtained inside the vehicle. The last curve will be the transfer function of a particular car. It can then be correlated with the frequency response of the installed woofer in order to predict its "behavior" with sufficient accuracy, make the necessary changes to the designed cabinet even before its construction begins, and as a result "adjust" the frequency response in the right direction. Naturally, we must take into account that a lot depends on the position of the subwoofer in the car. Therefore, it will not be superfluous to get transfer function graphs for several positions of the subwoofer, at the same time determining the optimal place for its installation.
4) All information on the screen of the measuring complex,
5) Voltage is removed from the poles of the speaker,
6) For "external" measurements, the microphone is located strictly along the axis of the cone. To carry out the first measurement, the test subwoofer must be mounted on the position selected for mounting a real box with a real speaker in the car. In our version, the sub (with the permission of the client of one of the Moscow installation centers) was placed on the right side of the cargo compartment of a 1995 Mitsubishi Eclipse. In order to avoid unnecessary discrepancies and errors in the final results, you must be absolutely sure of the identity of the specified parameters. That is, the distance from the speaker to the microphone (according to the generally recognized IASCA standards, it is installed in the area of \u25b\u10bthe headrest of the driver's seat), as well as the signal level (as a rule, at a frequency of XNUMX Hz it should exceed the noise level in the cabin by XNUMX dB) supplied to the speaker, with both ("inner" and "outer") measurements must be the same. Therefore, the values selected during the first ("internal") measurement can no longer be changed during the second.
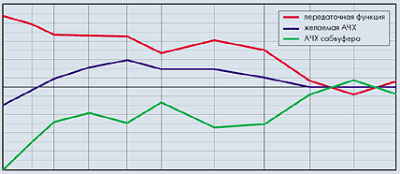
After the necessary information has appeared on the screen of the measuring complex, voltage readings are taken at the poles of the speaker using a digital voltmeter. Further it is better to be careful and not touch the gain control, the input and output sensitivity controls on the spectrum analyzer, and any other controls that may affect the level of the signal supplied to the speaker or the variable parameters of the RTA. The final step is to print out the information. Analyzers such as AudioControl SA-3050A or LinearX pcRTA allow you to get data in the form of a table, which is quite convenient for subsequent calculations. If the analyzer is not connected to a printer, then you have to manually record the signal level at the frequencies that appear on the display (20, 25, 31.5, 40, 50, 63, 80, 100, 125, 160 and 200 Hz). A table template can be obtained, for example, from the jbl.com website. The second stage, as we have already said, comes down to measurements outside the vehicle. Ideally, these should be done with minimal ambient noise, and the sound waves generated by the test subwoofer should not "bump" into any reflective surfaces. Since the ideal conditions of the so-called anechoic chamber are rarely achieved, a digestible option can be taken in a quiet room, in which the minimum distance from the speaker to the nearest wall is at least 10 meters. Otherwise, errors at the lowest bass frequencies are possible. A test subwoofer with a radiating surface facing the microphone is placed on a stand (table) at least one meter high from the floor. In turn, the microphone is located strictly along the central axis of the speaker cone at the same distance as for interior measurements. After that, using the same RTA, the frequency response is taken, and then the readings from the voltmeter. If the voltage at the speaker poles does not match the value that appeared in the previous measurement, then you will need to adjust the gain or volume on the head unit to bring the output level into line with the previously set parameters (but only in this case). Then the measurements are taken again. Further - everything is the same as in the previous stage: printing or writing the obtained values into a table. Now that you have the two frequency responses of your test subwoofer, you can begin to calculate the transfer function, which is to subtract the second set of SPL levels at the appropriate frequencies from the first. The results are entered into a table and marked with dots on the graph. Connecting the dots gives us a transfer function curve. Here's how it looks in our version. The question may arise: what to do next with this transfer function and for the sake of what to indulge in all serious? Everything is very simple. Knowing how the interior features affect the operation of the subwoofer, it is easier to choose the optimal type of acoustic design for the bass head and obtain the required frequency response of the bass unit. -For example, if you need a flat frequency response or a curve with a "hump" from 40 to 50 Hz (as in our case), then it (the curve) can be displayed on the same graph. The SPL values for each "edge" frequency from the ideal graph are entered in a separate column ("desired frequency response") of the table, and then the transfer function values are subtracted from them. The results are recorded in the "subwoofer frequency response" column and an "ideal" curve is built from them, that is, one that takes into account the influence of the cabin transfer function on bass reproduction.
Cabin transfer function
Author: A. Krasner, 12 Volt; Publication: 12voltsmagazine.com
Artificial leather for touch emulation
15.04.2024 Petgugu Global cat litter
15.04.2024 The attractiveness of caring men
14.04.2024
▪ Olympus Tough TG-870 rugged camera ▪ Bacteria for the space mining industry
▪ site section Regulators of current, voltage, power. Article selection ▪ article Chaplygin Sergei. Biography of a scientist ▪ article Why are we fooling everyone on April 1st? Detailed answer ▪ article Carbine choke. Travel Tips ▪ article Four balls. Focus secret
Home page | Library | Articles | Website map | Site Reviews
www.diagram.com.ua | |||||||||||||||||||||||||||||||||||||||||||||||||||||||||||||||||||||||||||||||||||||


 Leave your comment on this article: