|
|


 Arabic
 Bengali
 Chinese
 English
 French
 German
 Hebrew
 Hindi
Hindi Italian
 Japanese
 Korean
 Malay
Malay Polish
 Portuguese
 Spanish
 Turkish
 Ukrainian
 Vietnamese
|
Lecture notes, cheat sheets
Statistics. Cheat sheet: briefly, the most important
Directory / Lecture notes, cheat sheets Table of contents
GENERAL THEORY OF STATISTICS Topic 1. STATISTICS AS A SCIENCE 1.1. The subject and method of statistics as a social science In the very nature of man lies the desire for knowledge of the world, which finds its expression in the study and development of special branches of knowledge - the sciences. Each science, turning its gaze to the phenomena of the real world, develops specific features that distinguish one science from another. The essence of any science lies in the object and subject of knowledge, and different sciences can have one object of knowledge, but different subjects. The object of science is the phenomena of the real world, to which science extends its knowledge. The subject of science is a certain range of questions regarding the object of study, which relate to a part of the phenomenon or to some areas of the object. When clarifying the subject of science, the question of what the given science is studying is solved. The principles and methods of studying the subject of science constitute its methodology. Statistics is an independent social science that has its own subject and research methods, which arose from the needs of social life. The term "statistics" comes from the Latin word "status", which means "position, order". It was first used by the German scientist G. Achenwal (1719-1772). Currently, the term "statistics" is used in three meanings: - a special branch of practical activity of people aimed at collecting, processing and analyzing data characterizing the socio-economic development of a country, its regions, individual sectors of the economy or enterprises; - a science dealing with the development of theoretical provisions and methods used in statistical practice; - statistical data presented in the reporting of enterprises, sectors of the economy, as well as data published in collections, various directories, bulletins, etc. The object of statistics is the phenomena and processes of the socio-economic life of society, which reflect and find expression in the socio-economic relations of people. Depending on the object of study, statistics as a science is divided into several blocks (Fig. 1). 
Industry statistics Fig. 1.1. Structure of statistical science The general theory of statistics is the methodological basis, the core of all sectoral statistics, it develops the general principles and methods of the statistical study of social phenomena and is the most general category of statistics. The task of economic statistics is the development and analysis of synthetic indicators that reflect the state of the national economy, the relationship of industries, the peculiarities of the distribution of productive forces, the availability of material, labor and financial resources. Social statistics forms a system of indicators to characterize the way of life of the population and various aspects of social relations. In general, statistics is engaged in the collection of information of a different nature, its ordering, comparison, analysis and interpretation (explanation) and has the following distinctive features. First, statistics studies the quantitative side of social phenomena: magnitude, size, volume, and has a numerical value. Secondly, statistics explores the qualitative side of phenomena: specificity, an internal feature that distinguishes one phenomenon from others. The qualitative and quantitative aspects of a phenomenon always exist together, forming a unity. All social phenomena and events take place in time and space, and in relation to any of them it is always possible to establish when it arose and where it develops. Thus, statistics studies phenomena in specific conditions of place and time. The phenomena and processes of social life studied by statistics are in constant change and development. Based on the collection, processing and analysis of mass data on changes in the studied phenomena and processes, a statistical pattern is revealed. Statistical regularities manifest the actions of social laws that determine the existence and development of socio-economic relations in society. The subject of statistics is the study of social phenomena, the dynamics and direction of their development. With the help of statistical indicators, this science determines the quantitative side of a social phenomenon, observes the patterns of the transition of quantity into quality using the example of a given social phenomenon, and, based on these observations, analyzes data obtained under certain conditions of place and time. Statistics explores the socio-economic phenomena and processes that are massive, studies the many factors that determine them. Most of the social sciences use statistics to derive and confirm their theoretical laws. Conclusions based on statistical research are used by economics, history, sociology, political science and many other humanities. Statistics is necessary not only for the social sciences to confirm their theoretical basis, but its practical role is also great: not a single large enterprise or serious production, when developing a strategy for the economic and social development of an object, can do without analyzing statistical data. To do this, enterprises create special analytical departments and services that attract specialists who have undergone professional training in this discipline. Like any science, statistics has a certain methodology for studying its subject. As noted above, she is mainly interested in the development of the phenomenon and its connection with other phenomena of social life, so the method of statistics is chosen depending on the phenomenon under study and the specific subject of study. In statistics, specific methods and techniques for studying social phenomena have been developed and applied, which together form the method of statistics. These include observation, summary and grouping of data, calculation of generalizing indicators based on special methods (method of average indices, etc.). In accordance with the above, there are three stages of working with statistical data: - collection; - grouping and summary; - processing and analysis. Data collection is understood as mass scientifically organized observation, through which primary information about individual facts (units) of the phenomenon under study is obtained. Such a statistical accounting of a large number or all of the units that make up the phenomenon under study is the information base for statistical generalizations, for drawing conclusions about the phenomenon or process under study. The grouping and summary of data is understood as the distribution of a set of facts (units) into homogeneous groups and subgroups, the calculation of the results for each group and subgroup, and the presentation of the results in the form of a statistical table. Statistical analysis is the final stage of statistical research. It includes the processing of statistical data obtained during the summary, the interpretation of the results obtained in order to obtain objective conclusions about the state of the phenomenon under study and the patterns of its development. In the process of statistical analysis, the structure, dynamics and interconnection of social phenomena and processes are studied. The main stages of statistical analysis include: - establishing the facts and their assessment; - identification of characteristic features and causes of the phenomenon; - comparison of the phenomenon with normative, planned and other phenomena taken as the basis for comparison; - formulation of conclusions, forecasts, assumptions and hypotheses; - statistical testing of the proposed hypotheses. 1.2. Theoretical foundations and basic concepts of statistics The main provisions of statistics, on the one hand, are based on the laws of social and economic theory, since it is they who consider the patterns of development of social phenomena, determine their significance, causes and consequences for the life of society. On the other hand, the laws of many social sciences are built on the basis of statistics and patterns determined using statistical analysis. Thus, statistics determine the laws of the social sciences, and they, in turn, correct the provisions of statistics. The theoretical basis of statistics is closely related to mathematics, since to measure, compare and analyze quantitative characteristics, it is necessary to apply mathematical indicators, laws and methods: studying the dynamics of a phenomenon, its relationship with other phenomena is impossible without the use of higher mathematics and mathematical analysis. Very often, a statistical study is based on a developed mathematical model of a phenomenon. Such a mo- del theoretically reflects the quantitative ratios of the phenomenon under study. So, for example, when assessing the financial condition of an enterprise, A. Altman's scoring model is often used, where the level of bankruptcy Z is calculated using the following formula: Z = 1,2x1 + 1,4x2 + 3,3x3 + 0,6x4 + 10,0x5. According to Altman, Z ‹2,675 the firm is facing bankruptcy, and at Z › 2,675 The company's financial position does not inspire fear. To obtain this estimate, it is necessary to substitute the unknowns ?1, ?2, ?3, ?4 and ?5 , which are certain indicators of balance lines. Particularly widespread in statistical science are such areas of mathematics as probability theory and mathematical statistics. A number of theorems are widely used that express the law of large numbers, the analysis of variational series, and the forecasting of the development of phenomena is carried out with the help of extrapolations. Causal relationships of phenomena and processes are established using correlation and regression analysis. Finally, statistical science is indebted to mathematical statistics for its most important categories and concepts, such as totality, variation, sign, regularity. The statistical aggregate refers to the main categories of statistics and is the object of statistical research, which is understood as a systematic scientifically based collection of information about the socio-economic phenomena of public life and analysis of the data obtained. In order to perform a statistical study, a scientifically based information base is needed, which is a statistical set - a set of socio-economic objects or phenomena of social life, united by a qualitative basis, a common connection, but differing from each other in individual features, for example, a set of households, families, firms, etc. From the point of view of statistical methodology, a statistical population is a set of units that have such characteristics as mass character, uniformity, a certain integrity, interdependence of the state of individual units, and the presence of variation. The unit of the totality can be an object, fact, person, process, etc. The unit of the totality is the primary element and the bearer of its main features. The element of the population for which the necessary data for a statistical study is collected is called the unit of observation. The number of units in the population is called the size of the population. The statistical population can be the population at the census, enterprises, cities, employees of the company. The choice of a statistical population and its units depends on the specific conditions and nature of the socio-economic phenomenon or process being studied. The mass character of the units of the population is closely related to the completeness of the population, which is ensured by the coverage of the units of the statistical population under study. For example, the researcher must draw a conclusion about the development of banking. Therefore, he needs to collect information on all banks operating in the region. Since any set has a rather complex character, then completeness should be understood as the coverage of the set of the most diverse features of the set, which reliably and essentially describe the phenomenon under study. If, for example, financial results are not taken into account in the process of monitoring banks, then it is impossible to draw final conclusions about the development of the banking system. In addition, completeness involves the study of the characteristics of units of the population for the longest possible periods. Sufficiently complete data are, as a rule, massive and exhaustive. In practice, the studied socio-economic phenomena are extremely diverse, so it is difficult and sometimes impossible to cover all phenomena. The researcher is forced to study only a part of the statistical population, and draw conclusions for the entire population. In such situations, the most important requirement is the reasonable selection of that part of the population for which the characteristics are studied. This part should reflect the main properties of the phenomenon and be typical. In reality, several sets can interact in the phenomena and processes under study. In these situations, the studied populations should be clearly distinguished in the object of study. A sign of a unit of the population is a characteristic feature, feature, specific property, quality that can be observed and measured. The population studied in time or space must be comparable. For this, it is necessary to use, for example, uniform cost estimates. In order to qualitatively investigate the totality, the most significant or interrelated features are studied. The number of features characterizing the population unit should not be excessive, as this complicates the collection of data and processing of results. The characteristics of units of the statistical population must be combined so that they complement each other and have interdependence. The requirement of homogeneity of the statistical population means the choice of the criterion according to which one or another unit belongs to the population under study. For example, if the activity of young voters is studied, then it is necessary to determine the age limits of such voters in order to exclude people of the older generation. It is possible to limit such a population to representatives of rural areas or, for example, students. The presence of variation in units of the population means that their characteristics can take on different values or modifications. Such signs are called varying, and individual values or modifications are called variants. Signs are divided into attributive and quantitative. A sign is called attributive, or qualitative, if it is expressed by a semantic concept, for example, a person's gender or his belonging to a particular social group. Internally, they are divided into nominal and ordinal. An attribute is called quantitative if it is expressed as a number. According to the nature of variation, quantitative signs are divided into discrete and continuous. Discrete features are usually expressed as integers, such as the number of people in a family. Continuous features include, for example, age, salary, length of service, etc. According to the method of measurement, signs are divided into primary (accounted) and secondary (calculated). Primary (accounted for) express the unit of the population as a whole, i.e., absolute values. Secondary (calculated) are not directly measured, but calculated (cost, productivity). Primary features underlie the observation of a statistical population, while secondary features are determined in the process of data processing and analysis and represent the ratio of primary features. In relation to the characterized object, signs are divided into direct and indirect. Direct signs are properties that are directly inherent in a characteristic object (volume of production, age of a person). Indirect signs are properties that are not inherent in the object itself, but in other sets related to the object or included in it. In relation to time, instantaneous and interval signs are distinguished. Momentary signs characterize the object under study at some point in time, established by the plan of statistical research. Interval signs characterize the results of processes. Their values can occur only for a certain period of time. In addition to signs, the state of the object under study or the statistical population is characterized by indicators. Indicators - one of the basic concepts of statistics, which refers to a generalized quantitative assessment of socio-economic phenomena and processes. Depending on the target functions, statistical indicators are divided into accounting and evaluation and analytical. Accounting and evaluation indicators are a statistical characteristic of the size of socio-economic phenomena under certain conditions of place and time, reflecting the volume of distribution of phenomena in space or the levels reached at a certain time. Analytical indicators are used to analyze the data of the studied statistical population and characterize the features of the development of the studied phenomena. As analytical indicators in statistics, relative, average values, indicators of variation and dynamics, indicators of communication are used. A set of statistical indicators that reflect the relationships that exist between phenomena form a system of statistical indicators. In general, indicators and signs fully characterize and exhaustively describe the statistical population, allowing the researcher to conduct a comprehensive study of the phenomena and processes of the life of human society, which is one of the goals of statistical science. The most important category of statistics is a statistical regularity. Regularity is generally understood as a detectable causal relationship between phenomena, the sequence and repetition of individual features that characterize the phenomenon. In statistics, regularity is understood as the quantitative regularity of changes in space and time of mass phenomena and processes of social life as a result of the action of objective laws. Consequently, the statistical pattern is characteristic not of individual units of the population, but of the entire population as a whole and manifests itself only with a sufficiently large number of observations. Thus, the statistical regularity reveals itself as an average, social, mass regularity in the mutual cancellation of individual deviations of the values of signs in one direction or another. The manifestation of a statistical pattern makes it possible to present a general picture of the phenomenon, to study the trend of its development, excluding random, individual deviations. 1.3. Modern organization of statistics in the Russian Federation Statistics plays an important role in managing the economic and social development of the country, since the correctness of any management decision largely depends on the information on the basis of which it is made. Only accurate, reliable and correctly analyzed data should be taken into account at high levels of management. The study of the economic and social development of the country, individual regions, industries, firms, enterprises is carried out by specially created bodies that form the statistical service. In the Russian Federation, the functions of a statistical service are performed by state statistics bodies and departmental statistics bodies. The supreme body for managing statistics in our country is the Federal State Statistics Service (FSGS), established in accordance with Decree of the President of the Russian Federation of 09.03.2004 No. 314 "Structure of Federal Executive Authorities". The Federal State Statistics Service is a federal executive body that performs the functions of generating official statistical information on the social, economic, demographic and environmental situation of the country, as well as functions of control and supervision in the field of state statistical activities on the territory of the Russian Federation. The Federal State Statistics Service is under the jurisdiction of the Ministry of Economic Development and Trade of the Russian Federation. According to the Decree of the Government of the Russian Federation of 07.04.2004 No. 188, the main functions of the Federal State Statistics Service are: - presentation of statistical information in accordance with the established procedure to the President of the Russian Federation, the Government of the Russian Federation, the Federal Assembly of the Russian Federation, state authorities, the media, organizations and citizens, as well as international organizations; - development and improvement of a science-based official statistical methodology for conducting statistical observations and generating statistical indicators, ensuring that this methodology complies with international standards; - development and improvement of the system of statistical indicators characterizing the state of the economy and social sphere; - collection of statistical reporting and formation of official statistical information on its basis; - control over the implementation of organizations and citizens engaged in entrepreneurial activities without forming a legal entity, the legislation of the Russian Federation in the field of state statistics; - development of the information system of state statistics, ensuring its compatibility and interaction with other state information systems; - ensuring the storage of state information resources and the protection of confidential and classified as state secret statistical information; - implementation of the obligations of the Russian Federation arising from membership in international organizations and participation in international treaties, implementation of international cooperation in the field of statistics. The methodology of statistical indicators, forms and methods for collecting and processing statistical data established by the Federal State Statistics Service are the official statistical standards of the Russian Federation. In its main activities, the FSGS is guided by federal statistical programs, which are formed taking into account the proposals of the federal executive and legislative authorities, state authorities of the constituent entities of the Russian Federation, scientific and other organizations and are approved by the FSGS in agreement with the Government of the Russian Federation. The main task of the statistical authorities of the country is to ensure the publicity and accessibility of general (not individual) information, as well as guarantee the reliability, accuracy and truthfulness of the data taken into account. In addition, the tasks of the FSGS are: - presentation of official statistical information to the President of the Russian Federation, the Government of the Russian Federation, the Federal Assembly of the Russian Federation, federal executive authorities, the public, as well as international organizations; - coordination of the statistical activities of federal executive authorities and executive authorities of the constituent entities of the Russian Federation, providing conditions for the use of official statistical standards by these authorities when they conduct sectoral (departmental) statistical observations; - development of economic and statistical information, its analysis, compilation of national accounts, necessary balance calculations; - guaranteeing the completeness and scientific validity of all official statistical information; - providing all users with equal access to open statistical information by distributing official reports on the socio-economic situation of the Russian Federation, constituent entities of the Russian Federation, industries and sectors of the economy, publishing statistical collections and other statistical materials. As a result of reforming the economy of the Russian Federation, the structure of statistical bodies has also changed. Local district statistical registries have been abolished and inter-district statistical departments have been formed, which are representative offices of territorial statistical bodies. The organization of statistical bodies in Russia is now at the stage of reform. On fig. 1.2 shows the diagram of the statistical bodies of the Russian Federation for 2004. 
Fig. 1.2. Scheme of statistical bodies of the Russian Federation for 2004 Currently, the main areas in which reforms should be made can be noted: - compliance with the basic law of statistical accounting - publicity and availability of information while maintaining the confidentiality of individual indicators (trade secrets); - reforming the methodological and organizational foundations of statistics: changing the general tasks and principles of managing the economy leads to a change in the theoretical provisions of science; - improvement of the system for collecting and processing information by introducing such forms of observation as qualifications, registers (registries), censuses, etc.; - changing (improving) the methodology for calculating some statistical indicators characterizing the state of the Russian economy, taking into account international standards, foreign experience in statistical accounting, systematizing all indicators and bringing them into order that meets the issues and requirements of the time, taking into account the system of national accounts (SNA) ; - ensuring the relationship of statistical indicators characterizing the level of development of the country's public life; - taking into account the trend of computerization. In the course of reforming statistical science, a unified information base (system) should be created, which will include the information bases of all statistical bodies that are at a lower level of the hierarchical ladder of the organization of state statistics. At present, a lot of work has been done to organize the work of statistical bodies, but it has not yet been completed, and much attention remains to be paid to the improvement of this information institution, which is very important for the state. Along with state statistical services, there is departmental statistics, which is maintained in ministries, departments, enterprises, associations and firms in various sectors of the economy. Departmental statistics is engaged in the collection, processing and analysis of statistical information necessary for management, management decision-making, planning the activities of an enterprise or authority. In small enterprises, this work, as a rule, is carried out either by the chief accountant, or directly by the head himself. At large enterprises with their own branched regional structure or a large number of people, at large industries, entire departments or departments are organized that deal with the analysis of statistical information. This work involves specialists in the field of statistics, mathematics, accounting and economic analysis, managers and technologists. Such a "team", armed with modern computer technology, based on the methodology proposed by the theory of statistics and using modern methods of analysis, helps to build effective business development strategies, as well as effectively organize the activities of public authorities. It is impossible to manage complex social and economic systems without prompt, complete and reliable statistical information. Thus, the bodies of state and departmental statistics are faced with a very important task of theoretical substantiation of the volume and composition of statistical information that would correspond to modern conditions for the development of the economy, contribute to rationalization in the system of accounting and statistics and minimize the costs of performing this function. Topic 2. STATISTICAL OBSERVATION 2.1. The concept of statistical observation, the stages of its implementation A deep comprehensive study of any economic or social process involves measuring its quantitative side and characterizing its qualitative essence, place, role and relationships in the general system of social relations. Before starting to use statistical methods for studying the phenomena and processes of social life, it is necessary to have at your disposal an exhaustive information base that fully and reliably describes the object of study. The process of statistical research involves the following steps: - collection of statistical information (statistical observation) and its primary processing; - systematization and further processing of data obtained as a result of statistical observation, based on their summary and grouping; - generalization and analysis of the results of processing statistical materials, formulation of conclusions and recommendations based on the results of the entire statistical study. Statistical observation - the first and initial stage of statistical research, which is a systematic, systematically organized on a scientific basis, the process of collecting primary data on various phenomena of social and economic life. The regularity of statistical observation lies in the fact that it is carried out according to a specially developed plan, which includes issues related to the organization and technique of collecting statistical information, controlling its quality and reliability, and presenting the final materials. The mass nature of statistical observation is ensured by the most complete coverage of all cases of manifestation of the phenomenon or process under study, i.e., in the process of statistical observation, quantitative and qualitative characteristics are measured and recorded not by individual units of the population under study, but by the entire mass of units of the population. The systematic nature of statistical observation means that it should not be carried out randomly, that is, spontaneously, but should be carried out either continuously or regularly at regular intervals. The process of statistical observation is shown in fig. 2.1. 
Fig. 2.1. Statistical observation scheme The process of preparing a statistical observation involves determining the purpose and object of observation, the composition of features to be recorded, and choosing the unit of observation. It is also necessary to develop forms of documents for collecting data and choose the means and methods for obtaining them. Thus, statistical observation is a labor-intensive and painstaking work that requires the involvement of qualified personnel, its comprehensively thought-out organization, planning, preparation and implementation. 2.2. Types and methods of statistical observation The task of the general theory of statistics is to determine the forms, types and methods of statistical observation to decide where, when and what methods of observation to apply. The diagram below illustrates the classification of types of statistical observation (Fig. 2.2). 
Fig. 2.2. Classification of types of statistical observation Statistical observations can be divided into groups: - by coverage of population units; - time of registration of facts. According to the degree of coverage of the population under study, statistical observation is divided into two types: continuous and non-continuous. With continuous (full) observation, all units of the studied population are covered. Continuous observation provides completeness of information about the studied phenomena and processes. This type of observation is associated with high costs of labor and material resources, since it takes a lot of time to collect and process the entire amount of necessary information. Often continuous observation is not possible at all, for example, when the surveyed population is too large or it is not possible to obtain information about all units of the population. For this reason, non-continuous observations are carried out. With non-continuous observation, only a certain part of the population under study is covered, while it is important to determine in advance which part of the population under study will be subjected to observation and what criterion will be used as the basis for the sample. The advantage of conducting a non-continuous observation is that it is carried out in a short time, is associated with lower labor and material costs, and the information obtained is of an operational nature. There are several types of non-continuous observation: selective, observation of the main array, monographic. Selective is the observation of a part of the units of the studied population, selected by random selection. With the right organization, selective observation gives sufficiently accurate results that can be applied with a certain probability to the entire population. If sample observation involves the selection of not only units of the population under study (sampling in space), but also the points in time at which the registration of signs is carried out (sampling in time), such an observation is called the method of momentary observations. Observation of the main array covers a survey of certain, the most significant in terms of significance of the studied characteristics of the units of the population. In this observation, the largest units of the population are taken into account, and the most significant features for this study are recorded. For example, 15-20% of large credit institutions are examined, while the content of their investment portfolios is recorded. Monographic observation is characterized by a comprehensive and in-depth study of only individual units of the population that have some special characteristics or represent some new phenomenon. The purpose of such observation is to identify existing or only emerging trends in the development of a given process or phenomenon. In a monographic survey, individual units of the population are subjected to a detailed study, which allows you to fix very important dependencies and proportions that are not detectable with other, less detailed, observations. Statistical monographic surveys are often used in medicine, when examining family budgets, etc. It is important to note that monographic surveys are closely related to continuous and selective surveys. Firstly, data from mass surveys are needed to select the criterion for selecting population units for non-continuous and monographic observation. Secondly, monographic observation makes it possible to identify the characteristic features and essential features of the object of study, to clarify the structure of the studied population. The findings can be used as the basis for organizing a new mass survey. According to the time of registration of facts, observation can be continuous and discontinuous. Discontinuous, in turn, includes periodic and one-time. Continuous (current) observation is carried out by continuous registration of facts as they arise. With such an observation, all changes in the process or phenomenon under study are traced, which makes it possible to monitor its dynamics. For example, the registration of deaths, births, marriages by civil registry offices (ZAGS) is continuously conducted. The enterprises maintain current records of production, release of materials from the warehouse, etc. Intermittent observation is carried out either regularly, at certain intervals (periodic observation), or irregularly, once, as needed (one-time observation). Periodic observations are usually based on a similar program and tools so that the results of such surveys can be comparable. An example of periodic observation may be a population census, which is carried out at sufficiently long intervals, and all forms of statistical observations that are monthly, quarterly, semi-annual, annual, etc. in nature. One-time observation is characterized by the fact that facts are recorded not in connection with their occurrence, but according to their state or presence at a certain moment or over a period of time. Quantitative measurement of signs of a phenomenon or process occurs at the time of the survey, and re-registration of signs may not be carried out at all or the timing of its implementation is not predetermined. An example of a one-time observation is a one-time survey of the state of housing construction, which was conducted in 2000. Along with the types of statistical observation, the general theory of statistics considers methods for obtaining statistical information, the most important of which are the documentary method of observation, the method of direct observation, and the survey. Documentary observation is based on the use of data from various documents, such as accounting registers, as a source of information. Considering that, as a rule, high requirements are imposed on filling out such documents, the data reflected in them are of the most reliable nature and can serve as a high-quality source material for analysis. Direct observation is carried out by registering the facts personally established by the registrars as a result of inspection, measurement, and counting the signs of the phenomenon under study. In this way, prices for goods and services are recorded, measurements of working hours are made, an inventory of stock balances, etc. The survey is based on obtaining data from respondents (survey participants). The survey is used in cases where observation by other methods cannot be carried out. This type of observation is typical for conducting various sociological surveys and public opinion polls. Statistical information can be obtained by different types of surveys: expeditionary, correspondent, questionnaire, private. Expeditionary (oral) surveys are conducted by specially trained workers (registrators), who record the answers of respondents in observation forms. The form is a form of a document in which it is necessary to fill in the fields for answers. Correspondent survey assumes that, on a voluntary basis, the staff of respondents reports information directly to the monitoring body. The disadvantage of this method is that it is difficult to verify the correctness of the received information. In a questionnaire survey, respondents fill out questionnaires (questionnaires), voluntarily and mostly anonymously. Since this method of obtaining information is not reliable, it is used in those studies where high accuracy of the results is not required. In some situations, there are enough approximate results that capture only the trend and record the emergence of new facts and phenomena. A face-to-face survey involves the submission of information to the bodies conducting monitoring, on a face-to-face basis. In this way, acts of civil status are registered: marriages, divorces, deaths, births, etc. In addition to the types and methods of statistical observation, the theory of statistics also considers forms of statistical observation: reporting, specially organized statistical observation, registers. Statistical reporting is the main form of statistical observation, which is characterized by the fact that statistical authorities receive information about the phenomena under study in the form of special documents submitted by enterprises and organizations within a certain time frame and in the prescribed form. The forms of statistical reporting themselves, the methods of collecting and processing statistical data, the methodology of statistical indicators established by the Federal State Statistics Service are the official statistical standards of the Russian Federation and are mandatory for all subjects of public relations. Statistical reporting is divided into specialized and standard. The composition of indicators of standard reporting is the same for all enterprises and organizations, while the composition of indicators of specialized reporting depends on the specifics of individual sectors of the economy and the sphere activities. According to the timing of submission, statistical reporting is daily, weekly, ten-day, two-weekly, monthly, quarterly, semi-annual and annual. Statistical reporting can be transmitted by telephone, communication channels, on electronic media with mandatory subsequent submission on paper, certified by the signature of responsible persons. Specially organized statistical observation is a collection of information organized by statistical authorities either to study phenomena that are not covered by reporting, or to study reporting data in more depth, verify and refine them. Various kinds of censuses, one-time surveys are specially organized observations. Registers are a form of observation in which the facts of the state of individual units of the population are continuously recorded. Observing a unit of the population, it is assumed that the processes occurring there have a beginning, a long-term continuation and an end. In the register, each unit of observation is characterized by a set of indicators. All indicators are stored until the observation unit is in the register and has not ended its existence. Some indicators remain unchanged as long as the unit of observation is in the register, others may change from time to time. An example of such a register is the Unified State Register of Enterprises and Organizations (USRE). All work on its maintenance is carried out by the FSGS. So, the choice of types, methods and forms of statistical observation depends on a number of factors, the main of which are the goals and objectives of observation, the specifics of the observed object, the urgency of presenting results, the availability of trained personnel, the possibility of using technical means of collecting and processing data. 2.3. Program and methodological issues of statistical observation One of the most important tasks that must be solved when preparing a statistical observation is the definition of the purpose, object and unit of observation. The goals of almost any statistical observation are to obtain reliable information about the phenomena and processes of social life in order to identify the interrelationships of factors, assess the scale of the phenomenon and the patterns of its development. Based on the tasks of observation, its program and forms of organization are determined. In addition to the goal, it is necessary to establish the object of observation, that is, to determine what exactly is to be observed. The object of observation is the totality of social phenomena or processes to be studied. The object of observation can be a set of institutions (credit, educational, etc.), the population, physical objects (buildings, transport, equipment). When establishing the object of observation, it is important to strictly and accurately determine the boundaries of the population under study. To do this, it is necessary to clearly establish the essential features by which it is determined whether to include an object in the aggregate or not. For example, before conducting a survey of medical institutions for the provision of modern equipment, it is necessary to determine the category, departmental and territorial affiliation of the clinics to be surveyed. When defining the object of observation, it is necessary to specify the unit of observation and the unit of the population. The unit of observation is a constituent element of the object of observation, which is a source of information, i.e., the unit of observation is the carrier of signs to be registered. Depending on the specific tasks of statistical observation, this may be a household or a person, such as a student, an agricultural enterprise or a factory. Observation units are called reporting units if they submit statistical reports to the statistical authorities. The unit of the population is a constituent element of the object of observation, from which information about the unit of observation is received, i.e., the unit of the population serves as the basis for counting and has features that are subject to registration in the process of observation. For example, in a census of forest plantations, the unit of the population will be a tree, since it has characteristics that are subject to registration (age, species composition, etc.), while the forestry itself, in which the survey is conducted, acts as the unit of observation. Each phenomenon or process of social life has many features, but it is impossible to obtain information about all of them, and not all of them are of interest to the researcher, therefore, when preparing an observation, it is necessary to decide which features will be subject to registration in accordance with the goals and objectives of the observation. . To determine the composition of the registered features, an observation program is developed. The program of statistical observation is called a set of questions, the answers to which in the process of observation should form statistical information. The development of an observation program is a very important and responsible task, and the success of the observation depends on how correctly it is carried out. There are a number of requirements that need to be taken into account when developing an observation program: - the program should, if possible, contain only those features that are necessary and whose values will be used for further analysis or for control purposes. In an effort to complete the information that ensures the receipt of benign materials, it is necessary to limit the amount of information collected in order to obtain reliable material for analysis; - the questions of the program should be formulated clearly in order to exclude their incorrect interpretation and prevent the distortion of the meaning of the information being collected; - when developing an observation program, it is desirable to build a logical sequence of questions; questions of the same type or signs characterizing any one side of the phenomenon should be combined into one section; - the monitoring program should contain control questions for checking and correcting the recorded information. To carry out the observation, certain tools are needed: forms and instructions. Statistical form - a special document of a single sample, which records the answers to the questions of the program. Depending on the specific content of the observation being carried out, the form may be called a form of statistical reporting, a census or questionnaire, a map, a card, a questionnaire or a form. There are two types of forms: card and list. The card form, or individual form, is designed to reflect information about one unit of the statistical population, and the list form contains information about several units of the population. The integral and obligatory elements of the statistical form are the title, address and content parts. The title part indicates the name of the statistical observation and the body that approved this form, the terms for submitting the form and some other information. The address part contains the details of the reporting unit of observation. The main content part of the form usually looks like a table that contains the name, codes and values of indicators. The statistical form is filled in according to the instructions. The instruction contains instructions on the procedure for conducting observation, methodological instructions and explanations for filling out the form. Depending on the complexity of the surveillance program, the instruction is either published as a brochure or placed on the back of the form. In addition, for the necessary clarifications, you can contact the specialists responsible for conducting the observation, the bodies that conduct it. When organizing statistical observation, it is necessary to resolve the issue of the time of observation and the place of its conduct. The choice of the observation site depends on the purpose of the observation. The choice of observation time is associated with the determination of a critical moment (date) or time interval and the determination of the period (period) of observation. The critical moment of statistical observation is the point in time to which the information recorded in the process of observation is timed. The observation period determines the period during which the registration of information about the phenomenon under study should be carried out, that is, the time interval during which the forms are filled out. Usually, the observation period should not be too far from the critical moment of observation in order to reproduce the state of the object at that moment. 2.4. Issues of organizational support, preparation and conduct of statistical observation For the successful preparation and conduct of statistical observation, the issues of organizational support must be resolved. To do this, an organizational plan of observation is drawn up, which reflects the goals and objectives of observation, the object of observation, the place, time, timing of observation, and the circle of persons responsible for conducting the observation. An obligatory element of the organizational plan is the indication of the supervisory authority. The circle of organizations designed to assist in the monitoring is also determined, these may include internal affairs bodies, tax inspectorate, sectoral ministries, public organizations, individuals, volunteers, etc. The preparatory activities include: - development of forms of statistical observation, reproduction of the documentation of the survey itself; - development of a methodological apparatus for the analysis and presentation of observation results; - development of software for data processing, purchase of computer and office equipment; - purchase of necessary materials, including office supplies; - training of qualified personnel, training of personnel, conducting various kinds of briefings, etc.; - conducting mass explanatory work among the population and participants in the observation (lectures, conversations, speeches in the press, on radio and television); - coordination of activities of all services and organizations involved in joint actions; - equipment of the place of data collection and processing; - preparation of information transmission channels and means of communication; - solution of issues related to the financing of statistical observation. Thus, the monitoring plan contains a number of measures aimed at the successful completion of work on recording the necessary information. 2.5. Accuracy of observation and data validation methods Each specific measurement of the magnitude of the data, carried out in the process of observation, gives, as a rule, an approximate value of the magnitude of the phenomenon, which differs to some extent from the true value of this magnitude. The degree of compliance with the actual value of any indicator or feature obtained from observation materials is called the accuracy of statistical observation. The discrepancy between the result of observation and the true value of the magnitude of the observed phenomenon is called the error of observation. Depending on the nature, stage and causes of occurrence, several types of observation errors are distinguished (Table 2.1). Table 2.1 Classification of observation errors 
By their nature, errors are divided into random and systematic. Random errors are called errors, the occurrence of which is due to the action of random factors. These include reservations and misprints by the interviewee. They can be directed towards decreasing or increasing the value of the attribute; as a rule, they are not reflected in the final result, since they cancel each other out during the summary processing of the observation results. Systematic errors have the same tendency to either decrease or increase the value of the indicator of the attribute. This is due to the fact that measurements, for example, are made by a faulty measuring instrument or errors are the result of an inaccurate formulation of the question of the observation program, etc. Systematic errors are of great danger, since they significantly distort the results of observation. Depending on the stage of occurrence, registration errors are distinguished; errors that occur during the preparation of data for machine processing; errors that appear in the process of processing on computer technology. Registration errors include those inaccuracies that occur when data is recorded in a statistical form (primary document, form, report, census form) or when data is entered into computer technology, data distortion when transmitted through communication lines (telephone, e-mail). Often, registration errors occur due to non-compliance with the form of the form, that is, the entry was made in the wrong line or column of the document. There is also a deliberate distortion of the values of individual indicators. Errors in the preparation of data for machine processing or in the process of processing itself occur in computer centers or data preparation centers. The occurrence of such errors is associated with careless, incorrect, fuzzy filling in of data in forms, with a physical defect in the data carrier, with the loss of part of the data due to non-compliance with the information base storage technology, or are determined by equipment failures. Knowing the types and causes of observation errors, it is possible to significantly reduce the percentage of such information distortions. There are the following types of errors: measurement errors associated with certain errors that arise during a single statistical observation of the phenomenon and processes of social life; representativeness errors arising from non-continuous observation and related to the fact that the sample itself is not representative, and the results obtained on its basis cannot be extended to the entire population; deliberate errors arising from the deliberate distortion of data for various purposes, including the desire to embellish the actual state of the object of observation or, conversely, to show the unsatisfactory state of the object (this distortion of information is a violation of the law); unintentional errors, as a rule, of an accidental nature and associated with the low qualification of employees, their inattention or negligence. Often such errors are related to subjective factors, when people give incorrect information about their age, marital status, education, membership in a social group, etc., or simply forget some facts, telling the registrar information that just occurred to them. It is desirable to carry out some activities that will help prevent, identify and correct observational errors. These include: - selection of qualified personnel and high-quality training of personnel related to the conduct of surveillance; - organization of control checks of the correctness of filling out documents, by a continuous or selective method; - arithmetic and logical control of the received data after the completion of the collection of observation materials. The main types of data reliability control are syntactic, logical and arithmetic (Table 2.2). Table 2.2 Types and content of control 
Syntactic control means checking the correctness of the structure of the document, the presence of necessary and mandatory details, the completeness of filling in the form lines in accordance with the established rules. The importance and necessity of syntactic control is explained by the use of computer technology, scanners for data processing, which impose strict requirements on compliance with the rules for filling out forms. Logical control checks the correctness of writing codes, compliance with their names and values of indicators. The necessary relationships between indicators are checked, answers to various questions are compared and incompatible combinations are identified. To correct errors identified during logical control, they return to the original documents and make corrections. During arithmetic control, the obtained totals are compared with pre-calculated checksums for rows and columns. Quite often, arithmetic control is based on the dependence of one indicator on two or more others, for example, it is the product of other indicators. If the arithmetic control of the final indicators reveals that this dependence is not observed, this will indicate inaccuracy of the data. Thus, the control of the reliability of statistical information is carried out at all stages of statistical observation, from the collection of primary information to the stage of obtaining the results. Topic 3. STATISTICAL SUMMARY AND GROUPING 3.1. Tasks of the summary and its content Scientifically organized processing of statistical observation materials according to a pre-developed program includes, in addition to data control, systematization, data grouping, tabulation, obtaining results and derived indicators (average and relative values), etc. The material collected in the process of statistical observation is scattered primary information about individual units of the phenomenon under study. In this form, the material does not yet characterize the phenomenon as a whole: it does not give an idea either about the magnitude (number) of the phenomenon, or about its composition, or about the size of the characteristic features, or about the essence of the connections of this phenomenon with other phenomena, etc. There is a need for special processing of statistical data - a summary of observation materials. A summary of observation materials is a set of sequential actions to generalize specific single data that form a set in order to detect typical features and patterns inherent in the phenomenon under study as a whole. Statistical summary (simple summary) in the narrow sense of the word is an operation to calculate the total summary (summary) data for a set of observation units. Statistical summary (complex summary) in the broad sense of the word also includes the grouping of observation data, the calculation of general and group totals, obtaining a system of interrelated indicators, presentation of grouping and summary results in the form of statistical tables. A correct, scientifically organized summary, based on a preliminary deep theoretical analysis, allows you to get all the statistical results that reflect the most important, characteristic features of the object of study, measure the influence of various factors on the result and take all this into account in practical work when drawing up current and long-term plans. The task of the summary is to characterize the object of study with the help of systems of statistical indicators, to identify and measure in this way its essential features and characteristics. This task is solved in three stages: - definition of groups and subgroups; - definition of a system of indicators; - definition of types of tables. At the first stage, systematization, grouping of materials collected during observation is carried out. At the second stage, the system of indicators provided for by the plan is specified, with the help of which the properties and features of the subject under study are quantitatively characterized. At the third stage, the indicators themselves are calculated, and generalized data for clarity and convenience are presented in tables, statistical series, graphs, and charts. The listed stages of the summary, even before the start of its implementation, are reflected in a specially compiled program. The statistical summary program contains a list of groups into which it is advisable to divide the population, their boundaries in accordance with grouping characteristics; a system of indicators characterizing the totality, and the method of their calculation; a system of layouts of development tables in which the results of calculations will be presented. Along with the program, there is a summary plan that provides for its organization. The plan for conducting the summary should contain instructions on the sequence and timing of the implementation of its individual parts, on those responsible for its implementation, the procedure for presenting the results, and also provide for the coordination of the work of all organizations involved in its implementation. 3.2. Main tasks and types of groupings The subject of statistical research - mass phenomena and processes of social life - have numerous features and properties. Generalizing statistical data, revealing the most significant features, forms of development of a mass phenomenon as a whole and its individual components is impossible without certain scientific principles of data processing. Without overcoming the individual diversity of objects of statistical observation, the general patterns of development of a phenomenon or process as a whole are lost in the details and trifles that distinguish each object from one another, and the ultimate generalization entails a distorted idea of reality. To separate a set of units into groups of the same type, statistics uses the grouping method. Statistical groupings are the first stage of a statistical summary, which makes it possible to single out from the mass of the initial statistical material homogeneous groups of units that have a general similarity in qualitative and quantitative terms. It is important to understand that grouping is not a subjective technique for dividing a population into parts, but a scientifically based process of dividing a set of population units according to a certain attribute. The fundamental principle of applying the grouping method is a comprehensive, deep analysis of the essence and nature of the phenomenon under study, which makes it possible to determine its typical properties and internal differences. Any general collection is a complex of particular collections, each of which combines phenomena of a special type, of the same quality in a certain respect. Each type (group) has a specific system of features with a corresponding level of their quantitative values. To determine to which type, to which particular population the grouped units of the general population should be attributed, possibly on the basis of a correct, clear definition of the essential features by which the grouping should be carried out. This is the second important requirement of scientifically based grouping. The third grouping requirement is based on an objective, reasonable determination of the boundaries of groups, provided that the formed groups must unite homogeneous elements of the population, and the groups themselves (one in relation to the other) must differ significantly. Otherwise, grouping is meaningless. Thus, based on the application of the grouping method, groups are determined according to the principle of similarity and difference of population units. Similarity is the homogeneity of units within certain limits (groups); the difference is their significant divergence in groups. So, grouping is the division of the total population of units according to one or more essential characteristics into homogeneous groups that differ qualitatively and quantitatively and allow one to single out socio-economic types, study the structure of the population, or analyze the relationships between individual characteristics. The variety of social phenomena and the goals of their study makes it possible to use a large number of statistical groupings of phenomena and, on this basis, to solve a wide variety of specific problems. The main tasks solved with the help of groupings in statistics are the following: - selection in the totality of the studied phenomena of their socio-economic types; - study of the structure of social phenomena; - identification of links and dependencies between social phenomena. All groupings associated with the allocation in the totality of the studied phenomena of their socio-economic types occupy a central place in statistics. This task is related to the most significant, decisive aspects of public life, for example, grouping the population according to social status, gender, age, level of education, grouping enterprises and organizations according to their forms of ownership, industry affiliation. The construction of such groupings over long periods makes it possible to trace the process of development of socio-economic relations. The task of dismembering the totality of social phenomena according to their socio-economic types is solved by constructing typological groupings. Thus, a typological grouping is the division of a qualitatively heterogeneous study population into homogeneous groups of units in accordance with socio-economic types. An example of a typological grouping is a grouping according to the type of participating subjects of innovative activity in one of the regions, which can be divided into the following main groups of relationships (Table 3.1). Table 3.1 Grouping of subjects of innovative activity 
Exceptional importance is attached to the study of the structure of social phenomena, i.e., to the study of differences in the composition of any particular type of phenomena (correlation between the component parts of the phenomenon, changes in these ratios over a certain period of time). Thus, a structural grouping is a grouping in which a homogeneous population is divided into groups that characterize its structure according to some varying feature. Structural groupings include the grouping of the population by sex, age, level of education, the grouping of enterprises by the number of employees, the level of wages, the volume of work, etc. Changes in the structure of social phenomena reflect the most important patterns of their development. For example, grouping in table. Figure 3.2 shows that between 1959 and 1994 the urban population has steadily increased while the rural population has fallen, but between 1994 and 2002 the ratio of these population groups has not changed. Table 3.2 Grouping of the population of Russia by place of residence for 1959-2002 
The use of structural groupings allows not only to reveal the structure of the population, but also to analyze the processes under study, their intensity, changes in space, and structural groupings taken over a number of periods of time reveal the patterns of changes in the composition of the population over time. Structural groupings can be based on attributive or quantitative features. Their choice is determined by the objectives of a particular study and the nature of the population under study. The grouping given in table. 3.2, built on an attribute basis. In the case of structural grouping according to a quantitative attribute, it becomes necessary to determine the number of groups and their boundaries. This issue is resolved in accordance with the objectives of the study. One and the same statistical material can be divided into groups in different ways, depending on the goals and objectives of the study. The main thing is that in the process of grouping, the features of the phenomenon under study should be clearly reflected and the prerequisites for specific conclusions and recommendations should be created. In table. 3.3 shows a structural grouping according to a quantitative attribute. Table 3.3 Grouping families of residents of St. Petersburg by average per capita income (according to data for September - October 1996) 
In this table, the intervals of the groups are equal in size. If equal intervals are used, then their value is calculated according to the formula 
where h is the value of the interval, xmax and xmin are the maximum and minimum values of the characteristics of the population, k is the number of groups. It should be noted that it is technically more convenient to deal with equal intervals, but this is far from always possible due to the properties of the studied phenomena and features. In the economy, it is more often necessary to apply unequal, progressively increasing intervals, which is due to the very nature of economic phenomena. The use of unequal intervals is mainly due to the fact that the absolute change in the grouping trait by the same value is far from the same value for groups with a large and small value of the trait. For example, between two enterprises with up to 300 employees, a difference of 100 employees is more significant than for enterprises with more than 10 employees. Group intervals can be closed when the lower and upper limits are specified, and open when only one of the group boundaries is specified. Open intervals apply only to extreme groups. When grouping at unequal intervals, the formation of groups with closed intervals is desirable. This contributes to the accuracy of statistical calculations. One of the goals of statistical observation is to identify links and dependencies between social phenomena. An important task of statistical analysis carried out on the basis of a typological grouping, i.e., within single-qualitative aggregates, is the task of studying and measuring the relationship between individual features. Analytical grouping makes it possible to establish the existence of such a connection. Analytical grouping is a common method of statistical study of relationships that are found by parallel comparison of the generalized values of features by groups. There are dependent signs, the values of which change under the influence of other signs, they are usually called effective in statistics, and factorial ones that affect others. Usually, the basis of the analytical grouping is a sign-factor, and according to the effective signs, group averages are calculated, the change in the value of which determines the presence of a relationship between the signs. Thus, such groupings can be called analytical, which allow you to establish and study the relationship between the productive and factor characteristics of units of the same type of population. An important problem of analytical groupings is the correct choice of the number of groups and the determination of their boundaries, which subsequently ensures the objectivity of the characteristics of the connection. Since the analysis is carried out in single-qualitative aggregates, there are no theoretical grounds for splitting a certain type, therefore, it is permissible to split the population into any number of groups that meet certain requirements and conditions for a particular analysis. In the process of analytical groupings, the general rules of grouping should be observed, i.e. the units in the formed groups should be significantly different, the number of units in the groups should be sufficient to calculate reliable statistical characteristics. In addition, group averages must follow a certain pattern: increase or decrease consistently. The direct grouping of statistical observation data is the primary grouping. Secondary grouping - regrouping previously grouped data. The need for secondary grouping arises in two cases: - previously produced grouping does not meet the objectives of the study in relation to the number of groups; - to compare data relating to different periods of time or to different territories, if the primary grouping was carried out according to different grouping characteristics or at different intervals. There are two ways of secondary grouping: - consolidation of small groups into larger ones; - selection of a certain proportion of population units. In a scientifically substantiated grouping of social phenomena, it is necessary to take into account the interdependence of phenomena and the possibility of the transition of gradual quantitative changes in phenomena to fundamental qualitative changes. Grouping can be scientific only if not only the cognitive goals of the grouping are defined, but also the basis of the grouping is correctly chosen - the grouping attribute. If a grouping is a distribution into homogeneous groups according to some attribute or an association of individual units of a population into groups that are homogeneous according to some attribute, then a grouping attribute is a sign by which individual units of a population are combined into separate groups. When choosing a grouping attribute, it is not the way of expressing the attribute that is important, but its significance for the phenomenon under study. From this point of view, for grouping, one should take the essential features that express the most characteristic features of the phenomenon under study. The simplest grouping is the distribution series. Distribution series are series of numbers (numbers) that characterize the composition or structure of a phenomenon after grouping statistical data about this phenomenon, in other words, this is a grouping in which one indicator is used to characterize groups - the size of the group. An example of using a distribution series is given in Table. 3.4. Table 3.4 Application of distribution series 
The above distribution series contains three elements: a type of attribute (men, women); the number of units in each group, called the frequencies of the distribution series; the number of groups, expressed in shares (percentages) of the total number of units, called frequencies. The sum of the frequencies is 1 if they are expressed in fractions of one, and equal to 100% if they are expressed as a percentage. Rows built on an attribute basis are called attributive. Distribution series built on a quantitative basis are called variation series. The numerical values of a quantitative attribute in the variational distribution series are called variants and are arranged in a certain sequence. Variants can be expressed by positive and negative numbers, absolute and relative. Variational series are divided into discrete and interval. Discrete variational series characterize the distribution of population units according to a discrete (discontinuous) attribute, i.e., one that takes integer values. When constructing a distribution series with a discrete variation of a feature, all variants are written out in ascending order of their value, it is counted how many times the same value of the variant is repeated, i.e. frequency, and recorded in one line with the corresponding value of the variant, for example, the distribution of families by number children (Table 3.5). Frequencies in a discrete variation series, as well as in an attribute series, can be replaced by frequencies. Table 3.5 Application of a discrete distribution series 
In the case of continuous variation, the value of the attribute can take on any values in a certain interval, for example, the distribution of employees of the company by income level (Table 3.6). Table 3.6 Case of continuous variation 
When constructing an interval variation series, it is necessary to choose the optimal number of groups (character intervals) and set the length of the interval. The optimal number of groups is chosen so as to reflect the diversity of the trait values in the population. Most often, the number of groups is determined by the formula k = 1 + 3,32lg N = 1,44ln N + 1, where k is the number of groups; N - population size. For example, it is necessary to build a variation series of agricultural enterprises according to the yield of grain crops. Number of agricultural enterprises - 143. How to determine the number of groups? k = 1 + 3,32lg N = 1 + 3,32lg143 = 8,16. The number of groups can only be an integer, in this case 8 or 9. Example. The minimum yield is 30 q/ha, the maximum is 70 q/ha, and the number of targeted groups is 10. The interval value can be calculated using formula (3.1): 
If the resulting grouping does not meet the requirements of the analysis, then you can regroup. One should not strive for a very large number of groups, since in such a grouping the differences between groups often disappear. It is also necessary to avoid the formation of too small groups, including several units of the population, because in such groups the law of large numbers ceases to operate and the manifestation of chance is possible. When it is not possible to immediately identify possible groups, the collected material is first divided into a significant number of groups, and then they are enlarged, reducing the number of groups and creating qualitatively homogeneous groups. Thus, groupings in all cases should be constructed in such a way that the groups formed in them correspond to reality as fully as possible, differences between groups are visible, and phenomena that differ significantly from each other are not combined into one group. 3.3. Statistical tables After the data of statistical observation are collected and even grouped, it is difficult to perceive and analyze them without a certain, visual systematization. The results of statistical summaries and groupings are presented in the form of statistical tables. The statistical table gives a quantitative description of the statistical population and is a form of visual display of the resulting statistical summary and grouping of numerical (numerical) data. In appearance, the table is a combination of vertical and horizontal rows. It must have common side and top headings. Another feature of the statistical table is the presence of a subject (a characteristic of the statistical population) and a predicate (indicators characterizing the population). Statistical tables are the most rational form of presenting the results of a summary or grouping. The subject of the table represents the statistical population referred to in the table, i.e. a list of individual or all units of the population or their groups. Most often, the subject is placed on the left side of the table and contains a list of strings. The predicate of the table is those indicators with the help of which the characteristic of the phenomenon displayed in the table is given. The subject and predicate of the table can be arranged in different ways, the main thing is that the table is easy to read, compact and easy to understand. In statistical practice and research work, tables of varying complexity are used. It depends on the nature of the studied population, the amount of information available, and the tasks of analysis. If the subject of the table contains a simple list of any objects or territorial units, the table is called simple. The subject of a simple table does not contain any groupings of statistical data. These tables have the widest application in statistical practice, for example, the characteristics of cities in the Russian Federation in terms of population, average salary, etc. If the subject of a simple table contains a list of territories, for example, regions, territories, autonomous districts, republics, etc., then such the table is called territorial. A simple table contains only descriptive information, its analytical capabilities are limited. A deep analysis of the studied population, the relationship of signs involves the construction of more complex tables - group and combination. Group tables, unlike simple ones, contain in the subject not a simple list of units of the object of observation, but their grouping according to one essential attribute. The simplest type of group table are tables in which distribution series are presented (see Table 3.6). The group table can be more complex if the predicate contains not only the number of units in each group, but also a number of other important indicators that quantitatively and qualitatively characterize the subject groups. Such tables are often used to compare summary indicators across groups, which makes it possible to draw certain practical conclusions. Combination tables have wider analytical possibilities. Combination tables are called statistical tables, in the subject of which groups of units formed according to one attribute are divided into subgroups according to one or more attributes. Unlike simple and group tables, combinational tables allow us to trace the dependence of the predicate indicators on several features that formed the basis of the combinational grouping in the subject. Along with the tables listed above, contingency tables, or frequency tables, are used in statistical practice. The basis for the construction of such tables is the grouping of population units according to two or more characteristics, which are called levels. For example, the population is divided by gender (male, female), etc. Thus, feature A has n gradations (or levels): A1, A2, An (in our example, n = 2). Next, the interaction of feature A with another feature, B, is studied, which is subdivided into m gradations (factors): B1, B2, ..., Bm. In our example, attribute B is belonging to a profession, and B1, B2, Bm take on specific values (doctor, driver, teacher, builder, etc.). Grouping by two or more features is used to assess the relationship between features A and B. The results of observations can be represented by a contingency table consisting of n rows and m columns, the cells of which contain the event frequencies nij, i.e., the number of sample objects that have a combination of levels Aj and Bj. If there is a one-to-one direct or feedback functional relationship between variables A and B, then all frequencies nij are concentrated along one of the diagonals of the table. With a not so strong connection, a certain number of observations also fall on off-diagonal elements. Under these conditions, the researcher is faced with the task of finding out how accurately it is possible to predict the value of one feature from the value of another. A frequency table is said to be one-dimensional if only one variable is tabulated in it. A table based on a grouping by two features (levels) that are tabulated by two features (factors) is called a table with two inputs. Tables of frequencies in which the values of two or more features are tabulated are called contingency tables. Of all the types of statistical tables, simple tables are most widely used, group and especially combination statistical tables are used less often, and contingency tables are built for special types of analysis. Statistical tables serve as one of the important ways of expressing and studying mass social phenomena, but only if they are correctly constructed. The form of any statistical table should best suit the essence of the phenomenon it expresses and the purposes of its study. This is achieved by appropriate development of the subject and predicate of the table. Externally, the table should be small and compact, have a title, an indication of the units of measurement, as well as the time and place to which the information relates. Row headings and columns in the table are given briefly but clearly. Excessive clutter of the table with digital data, sloppy design makes it difficult to read and analyze it. We list the basic rules for constructing statistical tables: - the table should be compact and reflect only those initial data that directly reflect the studied socio-economic phenomenon in statics and dynamics; - the title of the table, the names of columns and lines should be clear, concise, concise. The title should reflect the object, sign, time and place of the event; - columns and lines should be numbered; - columns and lines should contain units of measurement for which there are generally accepted abbreviations; - information compared during the analysis is best placed in adjacent columns (or one under the other). This makes the comparison process easier; - for ease of reading and work, the numbers in the statistical table should be put down in the middle of the column, strictly one under the other: units - under units, comma - under comma; - it is advisable to round the numbers with the same degree of accuracy (up to a whole sign, up to a tenth); - the absence of data is indicated by the multiplication sign (x), if this position is not to be filled in, the absence of information is indicated by an ellipsis (...), or "n.d.", or "n.s.", in the absence of a phenomenon, a dash is put ( -); - to display very small numbers use the designation 0.0 or 0.00; - if the number is obtained on the basis of conditional calculations, then it is taken in brackets, doubtful numbers are accompanied by a question mark, and preliminary ones - by the sign (*). Where additional information is needed, statistical tables are accompanied by footnotes and notes explaining, for example, the nature of the specific indicator, the methodology applied, etc. Footnotes are used to indicate limited circumstances that must be taken into account when reading the table. If these rules are observed, the statistical table becomes the main means of presenting, processing and summarizing statistical information on the state and development of the studied socio-economic phenomena. 3.4. Graphical representations of statistical information The numerical indicators obtained as a result of a summary or statistical analysis as a whole can be presented not only in tabular, but also in graphical form. The use of graphs to present statistical information makes it possible to give visualization and expressiveness to statistical data, to facilitate their perception, and in many cases, analysis. The variety of graphical representations of statistical indicators provides great opportunities for the most expressive demonstration of a phenomenon or process. Graphs in statistics are conditional representations of numerical values and their ratios in the form of various geometric images: points, lines, flat figures, etc. A statistical graph allows you to immediately assess the nature of the phenomenon under study, its inherent patterns and features, development trends, the relationship characterizing its indicators . Each graph consists of a graphic image and auxiliary elements. A graphical image is a collection of points, lines and figures that are used to represent statistical data. Auxiliary elements of the graph include the common name of the graph, coordinate axes, scales, numerical grids and numerical data that complement and refine the displayed indicators. Auxiliary elements facilitate the reading of the graph and its interpretation. The title of the chart should briefly and accurately describe its content. Explanatory texts can be located within the graphic image or next to it, or placed outside it. Coordinate axes with scales printed on them and numerical grids are necessary for plotting and using it. Scales can be rectilinear or curvilinear (circular), uniform (linear) and uneven. Sometimes it is advisable to use the so-called conjugate scales built on one or two parallel lines. Most often, one of the conjugate scales is used to read the absolute values, and the second - the corresponding relative ones. The numbers on the scales are put down evenly, while the last number must exceed the maximum level of the indicator, the value of which is measured on this scale. The numerical grid, as a rule, should have a baseline, the role of which is usually played by the x-axis. Statistical graphs can be classified according to different criteria: purpose (content), method of construction and nature of the graphic image. According to the content, or purpose, we can distinguish:
According to the method of constructing graphics, they can be divided into charts and statistical maps. Charts are the most common way of graphic representations. These are graphs of quantitative relations. The types and methods of their construction are varied. Diagrams are used for visual comparison in various aspects (spatial, temporal, etc.) of values independent of each other: territories, population, etc. In this case, the comparison of the studied populations is carried out according to some significant varying attribute. Statistical maps - graphs of quantitative distribution over the surface. In their main purpose, they closely adjoin diagrams and are specific only because they represent conditional representations of statistical data on a contour geographic map, that is, they show the spatial distribution or spatial distribution of statistical data. According to the nature of the graphic image, there are dot, line, planar (column, strip, square, circular, sector, curly) and volumetric graphs. When constructing scatter diagrams, sets of points are used as graphic images, while when constructing linear diagrams, lines are used. The basic principle of constructing all planar diagrams is that statistical quantities are depicted in the form of geometric figures. Graphically, statistical maps are divided into cartograms and cartograms. Depending on the range of tasks to be solved, comparison diagrams, structural diagrams and dynamics diagrams are distinguished. The most common comparison charts are bar charts, the construction principle of which is to display statistical indicators in the form of vertically placed rectangles - bars. Each bar depicts the value of a separate level of the studied statistical series. Thus, comparison of statistical indicators is possible because all compared indicators are expressed in one unit of measure. When constructing bar charts, it is necessary to draw a system of lines angular coordinates in which the columns are located. The bases of the columns are located on the horizontal axis, the size of the base is determined arbitrarily, but is set the same for everyone. The scale that determines the scale of the columns in height is located along the vertical axis. The vertical size of each bar corresponds to the size of the statistic displayed on the chart. Thus, for all the bars that make up the chart, only one dimension is a variable. Placement of columns in the graph field can be different: at the same distance from each other; close to each other; in partial overlap. The rules for constructing bar charts allow the simultaneous placement of images of several indicators on the same horizontal axis. In this case, the columns are arranged in groups, for each of which a different dimension of varying features can be taken. Varieties of bar charts are the so-called strip and strip charts. Their difference lies in the fact that the scale is located horizontally at the top and determines the size of the strips along the length. The scope of bar and strip charts is the same, since the rules for their construction are identical. The one-dimensionality of the displayed statistical indicators and their one-scaleness for various columns and bands require the fulfillment of a single provision: compliance with proportionality (columns - in height, stripes - in length) and proportionality to the displayed values. To fulfill this requirement, it is necessary, firstly, that the scale on which the size of the column (band) is set starts from zero; secondly, this scale must be continuous, i.e., cover all the numbers of a given statistical series; the break of the scale and, accordingly, the columns (bands) is not allowed. Failure to comply with these rules leads to a distorted graphical representation of the analyzed statistical material. Bar and bar charts as a method of graphical representation of statistical data are interchangeable, i.e. the considered statistical indicators can equally be represented by both bars and bars. In both cases, to depict the magnitude of the phenomenon, one measurement of each rectangle is used - the height of the column or the length of the strip, therefore, the scope of these two diagrams is basically the same. A variety of bar and strip charts are directional charts. They differ from the usual two-sided arrangement of columns or stripes and have a scale origin in the middle. Typically, such diagrams are used to display values of the opposite qualitative value. Comparison between columns or strips directed in different directions is less effective than those located side by side in the same direction. Despite this, the analysis of directional diagrams allows us to draw meaningful conclusions, since a special arrangement gives the graph a bright image. The bilateral group includes diagrams of pure deviations. In them, the stripes are directed in both directions from the vertical zero line: to the right - for growth, to the left - for decrease. With the help of such diagrams, it is convenient to depict deviations from the plan or some level taken as the basis for comparison. An important advantage of the diagrams under consideration is the ability to see the range of fluctuations of the studied statistical feature, which in itself is of great importance for analysis. For a simple comparison of indicators that are independent of each other, diagrams can also be used, the construction principle of which is that the compared values are displayed in the form of regular geometric figures, which are constructed so that their areas correspond to the number that these figures display. In other words, these diagrams express the magnitude of the depicted phenomenon by the size of their area. To obtain diagrams of the type in question, various geometric shapes are used: a square, a circle, less often a rectangle. It is known that the area of a square is equal to the square of its side, and the area of a circle is determined in proportion to the square of its radius, so to build diagrams, you must first extract the square root from the compared values. Then, based on the results obtained, you need to determine the side of the square or the radius of the circle, respectively, according to the accepted scale. The most expressive and easily perceived is the method of constructing comparison diagrams in the form of figure-signs. In this case, statistical aggregates are represented not by geometric figures, but by symbols, or signs, reproducing to some extent the external image of statistical data. The advantage of this method of graphic representation lies in a high degree of clarity, in obtaining a similar display that reflects the content of the compared populations. The most important feature of any diagram is the scale, therefore, in order to correctly build a curly diagram, it is necessary to determine the unit of account. As the latter, a separate figure (symbol) is taken, which is conditionally assigned a specific numerical value. And the statistical value under study is represented by a separate number of figures of the same size, sequentially located in the figure. However, in most cases it is not possible to depict a statistic with a whole number of figures. The last of them has to be divided into parts, since in terms of scale one character is too large a unit of measurement. Usually this part is determined by eye. The difficulty of determining it exactly is a disadvantage of curly diagrams. However, greater accuracy in the presentation of statistical data is not pursued, and the results are quite satisfactory. As a rule, figure charts are widely used to popularize statistics and advertising. The main structure of structural diagrams is a graphical representation of the composition of statistical aggregates, characterized as the ratio of different parts of each of the aggregates. The composition of the statistical population can be graphically represented using both absolute and relative indicators. In the first case, not only the size of the parts, but also the size of the graph as a whole are determined by statistical values and change in accordance with the changes in the latter. In the second, the size of the entire graph does not change (since the sum of all parts of any set is 100%), but only the sizes of its individual parts change. The graphic representation of the composition of the population in terms of absolute and relative indicators contributes to a deeper analysis and allows for international comparisons and comparisons of socio-economic phenomena. The most common way to graphically represent the structure of statistical populations is a pie chart, which is considered the main form of a chart for this purpose. This is due to the fact that the idea of the whole is well and clearly expressed by a circle that reflects the whole set. The specific gravity of each part of the population in the pie chart is characterized by the value of the central angle (the angle between the radii of the circle). The sum of all the angles of a circle, equal to 360°, equates to 100%, and therefore 1% is taken equal to 3,6°. The use of pie charts allows not only to graphically depict the structure of the population and its change, but also to show the dynamics of the size of this population. To do this, circles are built that are proportional to the volume of the trait under study, and then its individual parts are distinguished by sectors. The considered method of graphic representation of the population structure has both advantages and disadvantages. Thus, a pie chart retains visibility and expressiveness only with a small number of parts of the population, otherwise its use is ineffective. In addition, the visibility of the pie chart decreases with minor changes in the structure of the depicted populations: it is higher if the differences in the compared structures are more significant. The advantage of bar and strip structural diagrams compared to pie charts is their large capacity, the ability to reflect a wider amount of useful information. However, these charts are more effective for small differences in the structure of the studied population. Dynamic diagrams are built to depict and make judgments about the development of a phenomenon in time. For a visual representation of phenomena in the series of dynamics, bar, strip, square, circular, linear, radial, etc. diagrams are used. The choice of the type of diagrams depends mainly on the characteristics of the initial data, the purpose of the study. For example, if there is a series of dynamics with several unequal levels in time (1914, 1949, 1980, 1985, 1996, 2003), then bar, square or pie charts are often used for clarity. They are visually impressive, well remembered, but not suitable for displaying a large number of levels, as they are cumbersome. When the number of levels in a series of dynamics is large, it is advisable to use line diagrams that reproduce the continuity of the development process in the form of a continuous broken line. In addition, line charts are convenient to use if: - the purpose of the study is to depict the general trend and nature of the development of the phenomenon; - on one graph it is necessary to depict several dynamic series in order to compare them; - the most significant is the comparison of growth rates, not levels. To build line graphs, a system of rectangular coordinates is used. Usually, time is plotted along the abscissa axis (years, months, etc.), and along the ordinate axis - the dimensions of the phenomena or processes depicted. Scales are applied on the y-axis. Particular attention should be paid to their choice, since the general appearance of the graph depends on this. In this graph, it is necessary to maintain balance, proportionality between the coordinate axes, since the imbalance between the coordinate axes gives an incorrect image of the development of the phenomenon. If the scale for the scale on the abscissa is very stretched compared to the scale on the y-axis, then fluctuations in the dynamics of phenomena stand out little, and vice versa, an increase in the scale on the y-axis compared to the scales on the abscissa gives sharp fluctuations. Equal time periods and level sizes should correspond to equal scale segments. In statistical practice, graphic images with uniform scales are most often used. Along the abscissa, they are taken in proportion to the number of time periods, and along the ordinate, in proportion to the levels themselves. The scale of the uniform scale will be the length of the segment taken as a unit. Often, one line chart contains several curves that give a comparative description of the dynamics of various indicators or the same indicator. However, more than three or four curves should not be placed on one graph, since a large number of them inevitably complicate the drawing and the linear diagram loses its clarity. In some cases, drawing two curves on one graph makes it possible to simultaneously depict the dynamics of the third indicator, if it is the difference between the first two. For example, when depicting the dynamics of fertility and mortality, the area between the two curves shows the amount of natural increase or natural decline in the population. Sometimes it is necessary to compare the dynamics of two indicators with different units of measurement on a graph. In such cases, you will need not one, but two scales. One of them is placed on the right, the other on the left. However, such a comparison of the curves does not give a sufficiently complete picture of the dynamics of these indicators, since the scales are arbitrary, therefore, the comparison of the dynamics of the level of two heterogeneous indicators should be carried out on the basis of using one scale after converting absolute values into relative ones. Linear charts with a linear scale have one drawback that reduces their cognitive value: a uniform scale allows you to measure and compare only the absolute increases or decreases in indicators reflected in the diagram during the study period. However, when studying the dynamics, it is important to know the relative changes in the studied indicators compared to the achieved level or the rate of their change. It is the relative changes in the economic indicators of dynamics that are distorted when they are depicted on a coordinate diagram with a uniform vertical scale. In addition, in conventional coordinates, it loses all clarity and even becomes impossible to depict time series with sharply changing levels, which usually take place in time series over a long period of time. In these cases, the uniform scale should be abandoned and the graph based on a semi-logarithmic system. The basic idea behind the semi-logarithmic system! consists in the fact that in it equal linear segments correspond to equal values of the logarithms of numbers. This approach has the advantage of being able to reduce the size of large numbers through their logarithmic equivalent. However, with a scale scale in the form of logarithms, the graph is difficult to understand. Next to the logarithms indicated on the scale scale, it is necessary to put down the numbers themselves, characterizing the levels of the displayed dynamics series, which correspond to the indicated numbers of logarithms. Graphs of this kind are called graphs on a semi-logarithmic grid. A semilogarithmic grid is a grid in which a linear scale is plotted on one axis and a logarithmic one on the other. Dynamics is also depicted by radial diagrams constructed in polar coordinates. Radial diagrams pursue the goal of a visual representation of a certain rhythmic movement in time. Most often, these charts are used to illustrate seasonal fluctuations. Radial diagrams are divided into closed and spiral. According to the construction technique, radial diagrams differ from each other depending on what is taken as a reference point - the center of the circle or the circle. Closed diagrams reflect the intra-annual cycle of the dynamics of any one year. Spiral charts! show the intra-annual cycle of dynamics for a number of years. The construction of closed diagrams is reduced to the following: a circle is drawn, the monthly average is equated to the radius of this circle. Then the whole circle is divided into 12 parts equal to the radius, which are shown on the graph as thin lines. Each radius denotes a month, and the location of the months is similar to the clock face: January - in the place where the clock is 1, February - where 2, etc. On each radius, a mark is made in a certain place according to the scale based on the data for the corresponding month. If the data exceeds the annual average, a mark is made outside the circle on the extension of the radius. Then the marks of different months are connected by segments. If, however, not the center of the circle, but the circle is taken as the basis for the report, then such diagrams are called spiral diagrams. The construction of spiral charts differs from closed ones in that in them December of one year is connected not with January of the same year, but with January of the next year. This makes it possible to depict the entire series of dynamics in the form of a spiral. Such a diagram is especially illustrative when, along with seasonal changes, there is a steady increase from year to year. Statistical maps1 are a type of graphic representation of statistical data on a schematic geographical map that characterizes the level or degree of distribution of a particular phenomenon in a certain area. The means of depicting territorial distribution are hatching, background coloring or geometric shapes. There are cartograms and cartograms. Cartograms are a schematic geographical map on which hatching of various density, dots or coloring of a certain degree of saturation shows the comparative intensity of any indicator within each unit of the territorial division plotted on the map (for example, population density by regions or republics, distribution of regions by grain yield crops, etc.). Cartograms are divided into background and point. Background cartogram - a type of cartogram, on which shading of various density or coloring of a certain degree of saturation shows the intensity of an indicator within a territorial unit. Dot cartogram - a kind of cartogram, where the level of the selected phenomenon is depicted using dots. A dot depicts one unit in the population or a certain number of them, showing on a geographical map the density or frequency of manifestation of a particular feature. Background cartograms, as a rule, are used to depict average or relative indicators, point cartograms - for volumetric (quantitative) indicators (population, livestock, etc.). The second large group of statistical maps are chart diagrams, which are a combination of diagrams with a geographical map. Chart figures (bars, squares, circles, figures, stripes) are used as figurative signs in cartograms, which are placed on the contour of a geographical map. Cartograms make it possible to reflect geographically more complex statistical and geographical constructions than cartograms. Among cartodigrams, it is necessary to single out cartodiacs of simple comparison, graphs of spatial displacement, isolines. On a cartogram of a simple comparison, unlike a regular chart, the chart figures depicting the values of the indicator under study are not arranged in a row, as in a regular chart, but are spread throughout the map in accordance with the region, region or country that they represent. Elements of the simplest cartographic diagram can be found on a political map, where cities are distinguished by various geometric shapes depending on the number of inhabitants. Isolines are lines of equal value of a quantity in its distribution on the surface, in particular on a geographical map or graph. The isoline reflects the continuous change of the studied quantity depending on two other variables and is used in mapping natural and socio-economic phenomena. Isolines are used to obtain quantitative characteristics of the studied quantities and to analyze the correlations between them. Topic 4. STATISTICAL VALUES AND INDICATORS 4.1. Purpose and types of statistical indicators and values The nature and content of statistical indicators corresponds to those economic and social phenomena and processes that reflect them. All economic and social categories or concepts are of an abstract nature, reflecting the most essential features, general interconnections of phenomena. And in order to measure the size and correlation of phenomena or processes, that is, to give them an appropriate quantitative characteristic, they develop economic and social indicators corresponding to each category (concept). It is the correspondence of indicators of the essence of economic categories that ensures the unity of the quantitative and qualitative characteristics of economic and social phenomena and processes. There are two types of indicators of the economic and social development of society: planned (forecast) and reporting (statistical). Planned indicators are certain specific values of indicators, the achievement of which is predicted in future periods. Reporting indicators (statistical) characterize the actual conditions of economic and social development, the level actually achieved for a certain period; it is an objective quantitative characteristic (measure) of a social phenomenon or process in its qualitative certainty under specific conditions of place and time. Each statistical indicator has a qualitative socio-economic content and an associated measurement methodology. A statistical indicator also has one or another statistical form (structure) and can express: - the total number of population units; - the total sum of the values of the quantitative attribute of these units; - the average value of the sign; - the value of this attribute in relation to the value of another, etc. The statistical indicator also has a certain quantitative value. This numerical value of a statistical indicator, expressed in certain units of measurement, is called the value of the indicator. The value of the indicator usually varies in space and fluctuates in time. Therefore, an obligatory attribute of a statistical indicator is also an indication of the territory and the moment or period of time. Statistical indicators can be conditionally divided into primary (volumetric, quantitative, extensive) and secondary (derivative, qualitative, intensive). Primary indicators characterize either the total number of population units, or the sum of the values of any of their attributes. Taken in dynamics, in change over time, they characterize the extensive path of development of the economy as a whole or a particular enterprise in a particular case. According to the statistical form, these indicators are total statistical values. Secondary indicators are usually expressed as average and relative values and, taken in dynamics, usually characterize the path of intensive development. Indicators that characterize the size of a complex set of socio-economic phenomena and processes are often called synthetic (gross domestic product (GDP), national income, social labor productivity, consumer basket, etc.). Depending on the units of measurement used, indicators are distinguished in kind, cost and labor (in man-hours, standard hours). Depending on the area Applications distinguish between indicators calculated at the regional, sectoral levels, etc. According to the accuracy of the reflected phenomenon, expected, preliminary and final values of indicators are distinguished. Depending on the volume and content of the object of statistical study, individual (characterizing individual units of the population) and summary (generalizing) indicators are distinguished. Thus, statistical values that characterize the masses or sets of units are called generalizing statistical indicators (values). Summary indicators play a very important role in statistical research due to the following distinctive features: give a summary (concentrated) description of the aggregates of units of the studied social phenomena; express the connections and dependencies existing between the phenomena and thus provide an interconnected study of the phenomena; characterize the changes occurring in phenomena, the emerging patterns of their development, etc., i.e., they perform an economic and statistical analysis of the phenomena under consideration, including on the basis of the decomposition of the generalizing quantities themselves into their constituent parts, factors that determine them, etc. An objective and reliable study of complex economic and social categories is possible only on the basis of a system of statistical indicators that, in unity and interconnection, characterize various aspects and aspects of the state and dynamics of development of these categories. Statistical indicators, objectively reflecting the unity and interrelationships of economic and social phenomena and processes, are not far-fetched, arbitrarily constructed dogmas, established once and for all. On the contrary, the dynamic development of society, science, computer technology, the improvement of statistical methodology lead to the fact that obsolete indicators that have lost their value change or disappear and new, more advanced indicators appear that objectively and reliably reflect the current conditions of social development. Thus, the construction and improvement of statistical indicators should be based on the observance of two basic principles: - objectivity and reality (indicators must truthfully and adequately reflect the essence of the relevant economic and social categories (concepts)); - comprehensive theoretical and methodological validity (the determination of the value of the indicator, its measurability and comparability in dynamics must be scientifically reasoned, clearly and easily formulated and unambiguously applicable in a uniform interpretation). In addition, the values of the indicators must be correctly quantified taking into account the level, scale and qualitative signs of the state or development of the corresponding economic or social phenomenon (industry and regional levels, an individual enterprise or employee, etc.). At the same time, the construction of indicators should be of a cross-cutting nature, allowing not only to summarize the relevant indicators, but also to ensure their qualitative homogeneity in groups and aggregates, the transition from one indicator to another in order to fully characterize the volume and structure of a more complex category or phenomenon. Finally, the construction of a statistical indicator, its structure and essence should provide for the possibility of comprehensively analyzing the phenomenon or process under study, characterizing the features of its development, and determining the factors influencing it. The calculation of statistical values and the analysis of data on the phenomena under study is the third and final stage of statistical research. In statistics, several types of statistical quantities are considered: absolute, relative and average values. Generalizing statistical indicators also include analytical indicators of time series, indices, etc. 4.2. Absolute statistics Statistical observation, regardless of its scope and goals, always provides information about certain socio-economic phenomena and processes in the form of absolute indicators, that is, indicators that are a quantitative characteristic of socio-economic phenomena and processes in conditions of qualitative certainty. The qualitative certainty of absolute indicators lies in the fact that they are directly related to the specific content of the phenomenon or process being studied, to its essence. In this regard, absolute indicators and absolute values should have certain units of measurement that would most fully and accurately reflect its essence (content). Absolute indicators are a quantitative expression of signs of statistical phenomena. For example, height is a feature, and its value is a measure of growth. An absolute indicator should characterize the size of the phenomenon or process being studied in a given place and at a given time, it should be "tied" to some object or territory and can characterize either a separate unit of the population (a separate object) - an enterprise, a worker, or a group of units, representing a part of the statistical population, or the statistical population as a whole, for example, the population in the country, etc. In the first case, we are talking about individual absolute indicators, and in the second - about summary absolute indicators. Individual are called absolute values that characterize the size of individual units of the population (for example, the number of parts manufactured by one worker per shift, the number of children in a separate family). They are obtained directly in the process of statistical observation and recorded in primary accounting documents. Individual indicators are obtained in the process of statistical observation of certain phenomena and processes as a result of evaluation, calculation, measurement of a fixed quantitative trait of interest. Summary absolute values are obtained, as a rule, by summing individual individual values. Summary absolute indicators are obtained as a result of summarizing and grouping the values of individual absolute indicators. So, for example, in the process of a population census, state statistical bodies receive final absolute data on the country's population, its distribution by region, by sex, age, etc. Absolute indicators can also include indicators that are obtained not as a result of statistical observation, but as a result of any calculation. As a rule, these indicators are the difference between two absolute indicators. For example, the natural increase (decrease) of the population is found as the difference between the number of births and the number of deaths for a certain period of time; the increase in production for the year is found as the difference between the volume of output at the end of the year and the volume of output at the beginning of the year. When compiling long-term forecasts for the development of the country's economy, estimated data on material, labor, and financial resources are calculated. As can be seen from the examples, these indicators will be absolute, as they have absolute units of measurement. Absolute values reflect the natural basis of phenomena, i.e., they express either the number of units of the studied population, its individual components, or their absolute sizes in natural units arising from their physical properties (weight, length, etc.), or in units measurements arising from their economic properties (cost, labor costs). Therefore, absolute values always have a certain dimension. In addition, absolute statistical indicators are always expressed in physical, cost and labor units of measurement, depending on the nature of the processes and phenomena they describe. Natural meters characterize phenomena in their natural form and are expressed in terms of length, weight, volume, etc., or the number of units, the number of events. Natural units include such units of measurement as ton, kilogram, meter, etc., for example: the volume of housing construction amounted to 2000 m2. In some cases, combined units of measurement are used, which are the product of two quantities expressed in different dimensions. So, for example, electricity generation is measured in kilowatt-hours, freight turnover is measured in ton-kilometers, etc. The group of natural units of measurement also includes the so-called conditionally natural units of measurement. They are used to obtain the total absolute values rank in the case when individual values characterize certain types of products that are similar in their consumer properties, but differ, for example, in fat content, alcohol, caloric content, etc. In this case, one of the types of products is taken as a conditional natural meter, and using conversion factors expressing the ratio of consumer properties (sometimes labor intensity, cost, etc.) of individual varieties, all varieties of this product are given. Labor units of measurement are used to characterize indicators that make it possible to assess labor costs, reflect the availability, distribution and use of labor resources, for example, the labor intensity of work performed in man-days. Natural, and sometimes labor meters do not allow to obtain summary absolute indicators in terms of heterogeneous products. In this regard, cost units of measurement are universal, which give a cost (monetary) assessment of socio-economic phenomena, characterize the cost of a certain product or the amount of work performed. For example, such important indicators for the country's economy as national income, gross domestic product are expressed in monetary terms, and at the enterprise level - profit, own and borrowed funds. The greatest preference in statistics is given to cost units, since cost accounting is universal, but it may not always be acceptable. Absolute indicators can be calculated in time and space. For example, the dynamics of the population of the Russian Federation from 1991 to 2004 is reflected by a time factor, and the level of prices for bakery products by regions of the Russian Federation in 2004 is characterized by a spatial comparison. When taking into account absolute indicators over time (in dynamics), their registration can be carried out on a specific date, i.e., at any point in time (the value of fixed assets of the enterprise at the beginning of the year) and for any period of time (the number of births per year) . In the first case, the indicators are instantaneous, in the second - interval. From the point of view of spatial certainty, absolute indicators are divided as follows: general territorial, regional and local. For example, the volume of GDP (gross domestic product) is a general territorial indicator, the volume of GRP (gross regional product) is a regional feature, the number of people employed in a city is a local feature, i.e. the first group of indicators characterizes the country as a whole, regional indicators characterize a specific region, local - a separate city, town, etc. Absolute indicators do not answer the question of what proportion this or that part has in the total population; they cannot characterize the levels of the planned target, the degree of fulfillment of the plan, the intensity of this or that phenomenon, since they are not always suitable for comparison and therefore are often used only for calculation of relative values. 4.3. Relative statistics Along with absolute values, one of the most important forms of generalizing indicators in statistics are relative values - these are generalizing indicators that express the measure of quantitative ratios inherent in specific phenomena or statistical objects. When calculating a relative value, the ratio of two interrelated values (mostly absolute) is measured, which is very important in statistical analysis. Relative values are widely used in statistical research, as they allow comparison of various indicators and make such a comparison clear. Relative values are calculated as the ratio of two numbers. In this case, the numerator is called the compared value, and the denominator is the base of the relative comparison. Depending on the nature of the phenomenon under study and the objectives of the study, the basic value can take on different values, which leads to different forms of expression of relative values. Relative quantities are measured: - in coefficients: if the base of comparison is taken as 1, then the relative value is expressed as an integer or fractional number, showing how many times one value is greater than the other or what part of it is; - in percent, if the base of comparison is taken as 100; - in ppm, if the comparison base is taken as 1000; - in decimilles, if the base of comparison is taken as 10; - in named numbers (km, kg, ha), etc. In each specific case, the choice of one or another form of relative value is determined by the objectives of the study and the socio-economic essence, the measure of which is the desired relative indicator. According to their content, relative values are divided into the following types: - fulfillment of contractual obligations; - speakers; - structures; - coordination; - intensity; - comparisons. The relative value of contractual obligations is the ratio of the actual performance of the contract to the level stipulated by the contract: 
This value reflects the extent to which the enterprise has fulfilled its contractual obligations, and can be expressed as a number (whole or fractional) or as a percentage. At the same time, it is necessary that the numerator and denominator of the initial ratio correspond to the same contractual obligation. Relative values of dynamics - growth rates - are indicators that characterize the change in the magnitude of social phenomena over time. The relative magnitude of the dynamics shows the change in the same type of phenomena over a period of time. This value is calculated by comparing each subsequent period with the original or previous. In the first case, we obtain the basic values of the dynamics, and in the second, the chain values of the dynamics. Both those and other values are expressed either as coefficients or as percentages. The choice of the comparison base when calculating the relative values of the dynamics, as well as other relative indicators, should be given special attention, since the practical value of the result obtained largely depends on this. The relative values of the structure characterize the constituent parts of the studied population. The relative value of the population is calculated by the formula: 
The relative values of the structure, commonly called specific weights, are calculated by dividing a certain part of the whole by the total, taken as 100%. This value has one feature - the sum of the relative values of the studied population is always equal to 100% or 1 (depending on how it is expressed). Relative values of the structure are used in the study of complex phenomena that fall into a number of groups or parts, to characterize the specific gravity (share) of each group in the overall total. Relative values of coordination characterize the ratio of individual parts of the population with one of them, taken as the basis for comparison. When determining this value, one of the parts of the whole is taken as the basis for comparison. With this value, you can observe the proportions between the components of the population. Indicators of coordination are, for example, the number of urban residents per 100 rural; the number of women per 100 men; Since the numerator and denominator of the relative values of coordination have the same unit of measurement, these values are expressed not in named numbers, but in percentages, ppm or multiple ratios. Relative intensity values are indicators that determine the prevalence of a given phenomenon in any environment. They are calculated as the ratio of the absolute value of a given phenomenon to the size of the environment in which it develops. Relative intensity values are widely used in the practice of statistics. An example of this value can be the ratio of the population to the area on which it lives, capital productivity, the provision of the population with medical care (the number of doctors per 10 population), the level of labor productivity (output per employee or per unit of working time), etc. . Thus, the relative values of intensity characterize the efficiency of the use of various kinds of resources (material, financial, labor), the social and cultural standard of living of the country's population, and many other aspects of public life. Relative intensity values are calculated by comparing opposite absolute values that are in a certain relationship with each other, and unlike other types of relative values, they are usually named numbers and have the dimension of those absolute values whose ratio they express. Nevertheless, in some cases, when the obtained calculation results are too small, they are multiplied for clarity by 1000 or 10, obtaining characteristics in ppm and decimille. Of particular interest is a variety of relative intensity values - gross domestic product per capita. Applying this indicator in various industries or specific types of products, one can obtain the following relative intensity values: production of electricity, fuel, machinery, equipment, services, goods, etc. per capita. Relative comparison values are relative indicators resulting from a comparison of the same-name levels related to different objects or territories, taken over the same period or at one point in time. They are also calculated in coefficients or percentages and show how many times one comparable value is greater or less than another. Relative comparison values are widely used in the comparative evaluation of various performance indicators of individual enterprises, cities, regions, countries. In this case, for example, the results of the work of a particular enterprise, etc. are taken as a basis for comparison and are consistently correlated with the results of similar enterprises in other industries, regions, countries, etc. In the statistical study of social phenomena, absolute and relative values complement each other. If absolute values characterize, as it were, the statics of phenomena, then relative values make it possible to study the degree, dynamics, and intensity of the development of phenomena. For the correct application and use of absolute and relative values in economic and statistical analysis, it is necessary: - take into account the specifics of phenomena when choosing and calculating one or another type of absolute and relative values (since the quantitative side of the phenomena characterized by these values is inextricably linked with their qualitative side); - to ensure the comparability of the compared and the basic absolute value in terms of the volume and composition of the phenomena they represent, the correctness of the methods for obtaining the absolute values themselves; - comprehensively use relative and absolute values in the analysis process and not separate them from each other (since the use of relative values alone in isolation from absolute ones can lead to inaccurate and even erroneous conclusions). Topic 5. AVERAGES AND INDICATORS OF VARIATION 5.1. Average values and general principles for their calculation Average values refer to generalizing statistical indicators that give a summary (final) characteristic of mass social phenomena, since they are built on the basis of a large number of individual values of a varying attribute. To clarify the essence of the average value, it is necessary to consider the features of the formation of the values of the signs of those phenomena, according to which the average value is calculated. It is known that the units of each mass phenomenon have numerous features. Whichever of these signs we take, its values for individual units will be different, they change, or, as they say in statistics, vary from one unit to another. So, for example, the salary of an employee is determined by his qualifications, the nature of work, length of service and a number of other factors, and therefore varies over a very wide range. The cumulative influence of all factors determines the amount of earnings of each employee, however, we can talk about the average monthly wages of workers in different sectors of the economy. Here we operate with a typical, characteristic value of a variable attribute, related to a unit of a large population. The average value reflects the general that is characteristic of all units of the studied population. At the same time, it balances the influence of all factors acting on the magnitude of the attribute of individual units of the population, as if mutually canceling them. The level (or size) of any social phenomenon is determined by the action of two groups of factors. Some of them are general and main, constantly operating, closely related to the nature of the phenomenon or process being studied, and form that typical for all units of the studied population, which is reflected in the average value. Others are individual, their action is less pronounced and is episodic, random. They act in the opposite direction, cause differences between the quantitative characteristics of individual units of the population, seeking to change the constant value of the characteristics being studied. The action of individual signs is extinguished in the average value. In the combined influence of typical and individual factors, which are balanced and mutually canceled out in generalizing characteristics, the fundamental law of large numbers known from mathematical statistics is manifested in a general form. In the aggregate, the individual values of the signs merge into a common mass and, as it were, dissolve. Hence, the average value appears as "impersonal", which can deviate from the individual values of the signs, not coinciding quantitatively with any of them. The average value reflects the general, characteristic and typical for the entire population due to the mutual cancellation in it of random, atypical differences between the signs of its individual units, since its value is determined, as it were, by the common resultant of all causes. However, in order for the average value to reflect the most typical value of a trait, it should not be determined for any populations, but only for populations consisting of qualitatively homogeneous units. This requirement is the main condition for the scientifically based application of averages and implies a close connection between the method of averages and the method of groupings in the analysis of socio-economic phenomena. Therefore, the average value is a generalizing indicator that characterizes the typical level of a variable trait per unit of a homogeneous population in specific conditions of place and time. Determining, thus, the essence of average values, it must be emphasized that the correct calculation of any average value implies the fulfillment of the following requirements: - qualitative homogeneity of the population, on which the average value is calculated. This means that the calculation of average values should be based on the grouping method, which ensures the selection of homogeneous, same-type phenomena; - exclusion of the influence on the calculation of the average value of random, purely individual causes and factors. This is achieved when the calculation of the average is based on sufficiently massive material in which the operation of the law of large numbers is manifested, and all accidents cancel each other out; - when calculating the average value, it is important to establish the purpose of its calculation and the so-called defining indicator (property), to which it should be oriented. The determining indicator can act as the sum of the values of the averaged feature, the sum of its reciprocals, the product of its values, etc. The relationship between the defining indicator and the average value is expressed as follows: if all values of the averaged feature are replaced by the average value, then their sum or product in in this case will not change the defining indicator. On the basis of this connection of the determining indicator with the average value, an initial quantitative ratio is built for the direct calculation of the average value. The ability of averages to preserve the properties of statistical populations is called the defining property. The average value calculated as a whole for the population is called the general average; the averages calculated for each group are the group averages. The general average reflects the general features of the phenomenon under study, the group average gives a description of the phenomenon that develops under the specific conditions of this group. The calculation methods can be different, therefore, in statistics, several types of average are distinguished, the main of which are the arithmetic average, the harmonic average and the geometric average. In economic analysis, the use of averages is the main tool for assessing the results of scientific and technological progress, social measures, and the search for reserves for economic development. At the same time, it should be remembered that excessive focus on averages can lead to biased conclusions when conducting economic and statistical analysis. This is due to the fact that average values, being generalizing indicators, cancel out and ignore those differences in the quantitative characteristics of individual units of the population that really exist and may be of independent interest. 5.2. Types of averages In statistics, various types of averages are used, which are divided into two large classes: - power averages (harmonic average, geometric average, arithmetic average, square average, cubic average); - structural averages (mode, median). To calculate the power means, it is necessary to use all the available values of the attribute. Mode and median are determined only by the structure of the distribution, so they are called structural, positional averages. The median and mode are often used as an average characteristic in those populations where the calculation of the mean exponential is impossible or impractical. The most common type of average is the arithmetic average. The arithmetic mean is understood as the value of the attribute that each unit of the population would have if the total of all values of the attribute were distributed evenly among all units of the population. The calculation of this value is reduced to the summation of all values of the variable attribute and the division of the resulting amount by the total number of population units. For example, five workers completed an order for the manufacture of parts, while the first produced 5 parts, the second - 7, the third - 4, the fourth - 10, the fifth - 12. Since in the initial data the value of each option occurred only once, to determine the average output of one worker should apply the simple arithmetic mean formula: 
i.e., in our example, the average output of one worker is equal to 
Along with the simple arithmetic mean, the weighted arithmetic mean is studied. For example, let's calculate the average age of students in a group of 20 people whose age ranges from 18 to 22 years, where xi are variants of the averaged feature, fi is the frequency that shows how many times the i-th value occurs in the population (Table 5.1). Table 5.1 Average age of students 
Applying the weighted arithmetic mean formula, we get: 
There is a certain rule for choosing a weighted arithmetic mean: if there is a series of data on two indicators, for one of which it is necessary to calculate the average value, and at the same time, the numerical values \uXNUMXb\uXNUMXbof the denominator of its logical formula are known, and the values of the numerator are unknown, but can be found as the product of these indicators , then the average value should be calculated according to the weighted arithmetic mean formula. In some cases, the nature of the initial statistical data is such that the calculation of the arithmetic mean loses its meaning and the only generalizing indicator can only be another type of average value - the harmonic mean. At present, the computational properties of the arithmetic mean have lost their relevance in the calculation of generalizing statistical indicators due to the widespread introduction of electronic computers. The average harmonic value, which is also simple and weighted, has acquired great practical importance. If the numerical values of the numerator of the logical formula are known, and the values of the denominator are unknown, but can be found as a private division of one indicator by another, then the average value is calculated by the weighted harmonic mean formula. For example, let it be known that the car traveled the first 210 km at a speed of 70 km/h, and the remaining 150 km at a speed of 75 km/h. It is impossible to determine the average speed of the car throughout the entire journey of 360 km using the arithmetic mean formula. Since the options are the speeds in separate sections xj = 70 km/h and X2 = 75 km/h, and the weights (fi) are the corresponding segments of the path, the products of options by weights will have neither physical nor economic meaning. In this case, it makes sense to divide the segments of the path into the corresponding speeds (options xi), i.e., the time spent on passing individual sections of the path (fi / xi). If the segments of the path are denoted by fi, then the entire path can be expressed as ?fi, and the time spent on the entire path as ? fi/xi , Then the average speed can be found as the quotient of the entire journey divided by the total time spent: 
In our example, we get: 
If, when using the average harmonic weight, all options (f) are equal, then instead of the weighted one, you can use a simple (unweighted) harmonic average: 
where xi - individual options; n is the number of variants of the averaged feature. In the example with speed, a simple harmonic mean could be applied if the segments of the path traveled at different speeds were equal. Any average value should be calculated so that when it replaces each variant of the averaged feature, the value of some final, generalizing indicator, which is associated with the averaged indicator, does not change. So, when replacing the actual speeds on individual sections of the path with their average value (average speed), the total distance should not change. The form (formula) of the average value is determined by the nature (mechanism) of the relationship of this final indicator with the averaged one, therefore the final indicator, the value of which should not change when replacing the options with their average value, is called the defining indicator. To derive the average formula, you need to compose and solve an equation using the relationship of the averaged indicator with the determining one. This equation is constructed by replacing the variants of the averaged feature (indicator) with their average value. In addition to the arithmetic mean and the harmonic mean, other types (forms) of the mean are also used in statistics. All of them are special cases of the power mean. If we calculate all types of power-law averages for the same data, then the values they turn out to be the same, the rule of majority of means applies here. As the exponent of the mean increases, so does the mean itself. The most commonly used formulas in practical research for calculating various types of power mean values are presented in Table. 5.2. Table 5.2 Types of Power Means 
The geometric mean is used when there are n growth factors, while the individual values of the attribute are, as a rule, relative values of the dynamics, built in the form of chain values, as a ratio to the previous level of each level in the dynamics series. The average thus characterizes the average growth rate. The geometric simple mean is calculated by the formula 
The formula for the geometric weighted average is as follows: 
The above formulas are identical, but one is applied at current coefficients or growth rates, and the second - at the absolute values of the levels of the series. The root mean square is used when calculating with the values of square functions, it is used to measure the degree of fluctuation of the individual values of a trait around the arithmetic mean in the distribution series and is calculated by the formula 
The weighted root mean square is calculated using a different formula: 
The average cubic is used when calculating with the values of cubic functions and is calculated by the formula 
weighted average cubic: 
All the above average values can be represented as a general formula: 
where is the average value; - individual value; n is the number of units of the studied population; k - exponent that determines the type of average. When using the same initial data, the more k in the general power mean formula, the greater the average value. It follows from this that there is a regular relationship between the values of power means: 
The average values described above give a generalized idea of the population under study, and from this point of view, their theoretical, applied, and cognitive significance is indisputable. But it happens that the value of the average does not coincide with any of the really existing options, therefore, in addition to the considered averages, in statistical analysis it is advisable to use the values of specific options that occupy a well-defined position in an ordered (ranked) series of attribute values. Among such quantities, the most common are structural, or descriptive, averages - mode (Mo) and median (Me). Mode is the value of a feature that occurs most often in a given population. With regard to the variational series, the mode is the most frequently occurring value of the ranked series, i.e., the variant with the highest frequency. Fashion can be used to determine the most visited stores, the most common price for any product. It shows the size of the feature characteristic of a significant part of the population, and is determined by the formula 
where x0 is the lower limit of the interval; h - interval value; fm - interval frequency; fm_1 - frequency of the previous interval; fm+1 - frequency of the next interval. The median is the variant located in the center of the ranked series. The median divides the series into two equal parts in such a way that on both sides of it there is the same number of population units. At the same time, in one half of the population units, the value of the variable attribute is less than the median, in the other half it is greater than it. The median is used when examining an element whose value is greater than or equal to or simultaneously less than or equal to half of the elements of the distribution series. The median gives a general idea of where the values of the feature are concentrated, in other words, where is their center. The descriptive nature of the median is manifested in the fact that it characterizes the quantitative boundary of the values of the varying attribute, which are possessed by half of the population units. The problem of finding the median for a discrete variational series is solved simply. If all units of the series are given serial numbers, then the serial number of the median variant is defined as (n + 1) / 2 with an odd number of members n. If the number of members of the series is an even number, then the median will be the average value of two variants with serial numbers n / 2 and n / 2 + 1. When determining the median in interval variation series, the interval in which it is located (the median interval) is first determined. This interval is characterized by the fact that its accumulated sum of frequencies is equal to or exceeds half the sum of all frequencies of the series. The calculation of the median of the interval variation series is carried out according to the formula 
where X0 is the lower limit of the interval; h - interval value; fm - interval frequency; f is the number of members of the series; ?m-1 - the sum of the accumulated members of the series preceding this one. Along with the median, for a more complete characterization of the structure of the studied population, other values of options are also used, which occupy a quite definite position in the ranked series. These include quartiles and deciles. Quartiles divide the series by the sum of frequencies into 4 equal parts, and deciles - into 10 equal parts. There are three quartiles and nine deciles. The median and mode, in contrast to the arithmetic mean, do not cancel out individual differences in the values of a variable attribute and, therefore, are additional and very important characteristics of a statistical population. In practice, they are often used instead of the average or along with it. It is especially expedient to calculate the median and mode in those cases when the studied population contains a certain number of units with a very large or very small value of the variable attribute. These values of options, which are not very characteristic for the population, while affecting the value of the arithmetic mean, do not affect the values of the median and mode, which makes the latter very valuable indicators for economic and statistical analysis. 5.3. Indicators of variation The purpose of a statistical study is to identify the main properties and patterns of the studied statistical population. In the process of summary processing of statistical observation data, distribution series are built. There are two types of distribution series - attributive and variational, depending on whether the attribute taken as the basis of the grouping is qualitative or quantitative. Variational distribution series are called, built on a quantitative basis. The values of quantitative characteristics for individual units of the population are not constant, more or less differ from each other. This difference in the size of a trait is called variation. Separate numerical values of a feature that occur in the studied population are called value variants. The presence of variation in individual units of the population is due to the influence of a large number of factors on the formation of the trait level. The study of the nature and degree of variation of signs in individual units of the population is the most important issue of any statistical study. Variation indicators are used to describe the measure of trait variability. Another important task of statistical research is to determine the role of individual factors or their groups in the variation of certain features of the population. To solve such a problem in statistics, special methods for studying variation are used, based on the use of a system of indicators that measure variation. In practice, the researcher is faced with a sufficiently large number of options for the values of the attribute, which does not give an idea of the distribution of units according to the value of the attribute in the aggregate. To do this, all variants of the attribute values are arranged in ascending or descending order. This process is called series ranking. The ranked series immediately gives a general idea of the values that the feature takes in the aggregate. The insufficiency of the average value for an exhaustive characterization of the population makes it necessary to supplement the average values with indicators that make it possible to assess the typicality of these averages by measuring the fluctuation (variation) of the trait under study. The use of these indicators of variation makes it possible to make the statistical analysis more complete and meaningful, and thus to better understand the essence of the studied social phenomena. The simplest signs of variation are minimum and maximum - this is the smallest and largest value of the feature in the aggregate. The number of repetitions of individual variants of feature values is called the frequency of repetition. Let us denote the frequency of repetition of the value of the sign fi, the sum of frequencies equal to the volume of the studied population will be: 
where k is the number of attribute value options. It is convenient to replace frequencies with frequencies - wi. Frequency - a relative indicator of frequency - can be expressed in fractions of a unit or a percentage and allows you to compare variation series with a different number of observations. Formally we have: 
To measure the variation of a trait, various absolute and relative indicators are used. The absolute indicators of variation include the mean linear deviation, the range of variation, variance, standard deviation. The range of variation (R) is the difference between the maximum and minimum values of the trait in the studied population: R = Xmax - Xmin. This indicator gives only the most general idea of the fluctuation of the trait under study, as it shows the difference only between the extreme values of the options. It is completely unrelated to the frequencies in the variational series, that is, to the nature of the distribution, and its dependence can give it an unstable, random character only from the extreme values of the trait. The range of variation does not provide any information about the features of the studied populations and does not allow us to assess the degree of typicality of the obtained average values. The scope of this indicator is limited to fairly homogeneous populations, more precisely, it characterizes the variation of a trait, an indicator based on taking into account the variability of all values of the trait. To characterize the variation of a trait, it is necessary to generalize the deviations of all values from any value typical for the population under study. Variation indicators such as mean linear deviation, variance and standard deviation are based on the consideration of deviations of the values of the attribute of individual units of the population from the arithmetic mean. The average linear deviation is the arithmetic average of the absolute values of the deviations of individual options from their arithmetic average: 
- the absolute value (modulus) of the deviation of the variant from the arithmetic mean; f- frequency. The first formula is applied if each of the options occurs in the aggregate only once, and the second - in series with unequal frequencies. There is another way to average the deviations of options from the arithmetic mean. This method, which is very common in statistics, is reduced to calculating the squared deviations of options from the mean value and then averaging them. In this case, we get a new indicator of variation - the variance. Dispersion (?2) - the average of the squared deviations of the variants of the trait values from their average value: 
The second formula is used if the variants have their own weights (or frequencies of the variation series). In economic and statistical analysis, it is customary to evaluate the variation of an attribute most often using the standard deviation. The standard deviation (?) is the square root of the variance: 
The mean linear and mean square deviations show how much the value of the attribute fluctuates on average for the units of the population under study, and are expressed in the same units as the variants. In statistical practice, it often becomes necessary to compare the variation of various features. For example, it is of great interest to compare variations in the age of personnel and their qualifications, length of service and wages, etc. For such comparisons, indicators of the absolute variability of signs - the average linear and standard deviation - are not suitable. It is impossible, in fact, to compare the fluctuation of work experience, expressed in years, with the fluctuation of wages, expressed in rubles and kopecks. When comparing the variability of various traits in the aggregate, it is convenient to use relative indicators of variation. These indicators are calculated as the ratio of absolute indicators to the arithmetic mean (or median). Using the range of variation, the average linear deviation, the standard deviation as an absolute indicator of variation, one obtains the relative indicators of fluctuation:
- the most commonly used indicator of relative volatility, characterizing the homogeneity of the population. The set is considered homogeneous if the coefficient of variation does not exceed 33% for distributions close to normal. Topic 6. SAMPLE OBSERVATION 6.1. General concept of selective observation Statistical observation can be organized as continuous and non-continuous. Continuous involves the examination of all units of the studied population of the phenomenon, non-continuous - only its parts. Selective observation also belongs to discontinuous. Selective observation is one of the most widely used types of non-continuous observation. This observation is based on the idea that some of the units selected in a random order can represent the entire studied set of the phenomenon according to the characteristics of interest to the researcher. The purpose of sample observation is to obtain information, first of all, to determine the summary generalizing characteristics of the entire population under study. In its purpose, selective observation coincides with one of the tasks of continuous observation, and therefore the question arises as to which of the two types of observation - continuous or selective - is more appropriate to carry out. When resolving this issue, it is necessary to proceed from the following basic requirements for statistical observation: - information must be reliable, i.e. correspond to reality as much as possible; - information must be complete enough to solve the research problems; - the selection of information should be carried out as soon as possible for its use for operational purposes; - cash and labor costs for organizing and conducting should be minimal. With selective observation, these requirements are met to a greater extent than with continuous observation. The advantages of this method in comparison with the continuous one can be appreciated if it is organized and carried out in strict accordance with the scientific principles of the theory of the sampling method, namely, ensuring the randomness of the selection of units and their sufficient number. Compliance with these principles makes it possible to obtain such a set of units that represents the entire studied set according to the characteristics of interest to the researcher, i.e., is representative (representative). When conducting selective observation, not all units of the object under study are examined, that is, not all units of the population, but only some specially selected part. The first principle of selection - ensuring randomness - lies in the fact that when selecting each of the units of the population under study, an equal opportunity to get into the sample is provided. Random selection is not random selection, but selection according to a certain methodology, for example, selection by lot, use of a table of random numbers, etc. The second principle of selection - ensuring a sufficient number of selected units - is closely related to the concept of representativeness of the sample. Since any selective observation is carried out with a specific purpose and clearly formulated specific tasks, the concept of representativeness is precisely related to the purpose and objectives of the study. The part selected from the entire studied population should be representative, first of all, in relation to those features that are being studied or have a significant impact on the formation of summary generalizing characteristics. In sample observation, the concepts of "general population" are used - the studied population of units to be studied according to the characteristics of interest to the researcher, and "sample population" - some part of it randomly selected from the general population. This sample is subject to the requirement of representativeness, i.e., when studying only a part of the general population, the findings can be applied to the entire population. The characteristics of the general and sample populations can be the average values of the studied features, their variances and standard deviations, mode and median, etc. Researchers may also be interested in the distribution of units according to the characteristics under study in the general and sample populations. In this case, the frequencies are called general and sample frequencies, respectively. The system of selection rules and ways of characterizing the units of the population under study is the content of the sampling method, the essence of which is to obtain primary data when observing the sample, followed by generalization, analysis and their distribution to the entire population in order to obtain reliable information about the phenomenon under study. The representativeness of the sample is ensured by the observance of the principle of random selection of objects in the population in the sample. If the population is qualitatively homogeneous, then the principle of randomness is implemented by a simple random selection of sample objects. Simple random selection is such a sampling procedure that provides for each unit of the population the same probability of being selected for observation, for any sample of a given size. Thus, the purpose of the sampling method is to draw a conclusion about the meaning of the characteristics of the general population based on information from a random sample from this population. 6.2. Sampling errors Between the characteristics of the sample population and the characteristics of the general population, as a rule, there is some discrepancy, which is called the error of statistical observation. During mass observation, errors are inevitable, but they arise as a result of various reasons. The amount of sampling error that can occur is due to registration errors and representativeness errors. Registration errors, or technical errors, are associated with insufficient qualifications of observers, inaccurate calculations, imperfection of instruments, etc. The error of representativeness (representation) is understood as the discrepancy between the sample characteristic and the expected characteristic of the general population. Representativeness errors can be random or systematic. Systematic errors are associated with violation of established selection rules. Random errors are explained by insufficiently uniform representation in the sample set of various categories of units of the general population. As a result of the first reason, the sample can easily turn out to be biased, since in the selection of each unit an error is made, always directed in the same direction. This error is called the offset error. Its size may exceed the value of a random error. A feature of the bias error is that, being a constant part of the representativeness error, it increases with the sample size. Random error decreases with increasing sample size. In addition, the magnitude of the random error can be determined, while the size of the bias error is very difficult, and sometimes impossible, to practically determine, so it is important to know the causes of the bias error and provide for measures to eliminate it. Bias errors can be intentional or unintentional. The reason for the intentional error is a biased approach to the selection of units from the general population. In order to prevent the occurrence of such an error, it is necessary to observe the principle of random selection of units. Unintentional errors can occur at the stage of preparing a sample observation, forming a sample population and analyzing its data. To avoid such errors, a good sampling frame is needed, i.e. the population from which the sample is supposed to be made, for example, a list of sampling units. The sampling frame must be reliable, complete and consistent with the purpose of the study, and the sampling units and their characteristics must correspond to their actual state at the time the sample observation was prepared. It is not uncommon for some units in the sample to be difficult to collect information due to their absence at the time of observation, unwillingness to provide information, etc. In such cases, these units have to be replaced by others. It is necessary to ensure that the replacement is carried out by equivalent units. Random sampling error occurs as a result of random differences between the units in the sample and the units of the general population, i.e. it is associated with random selection. The theoretical justification for the appearance of random sampling errors is the theory of probability and its limit theorems. The essence of limit theorems is that in mass phenomena the cumulative influence of various random causes on the formation of regularities and generalizing characteristics will be an arbitrarily small value or practically does not depend on the case. Since random sampling error occurs as a result of random differences between the units of the sample and the general population, then with a sufficiently large sample size, it will be arbitrarily small. The limit theorems of probability theory allow one to determine the size of random sampling errors. Distinguish between the mean (standard) and marginal sampling errors. Under the average (standard) sampling error is understood such a discrepancy between the average sample and the general population (~ -), which does not exceed ±. The marginal sampling error is considered to be the maximum possible discrepancy (~ -), i.e., the maximum error for a given probability of its occurrence. In the mathematical theory of the sampling method, the average characteristics of the characteristics of the sample and the general population are compared and it is proved that with an increase in the sample size, the probability of large errors and the limits of the maximum possible error decrease. The more units are surveyed, the smaller the discrepancy between the sample and general characteristics will be. Based on the theorem proved by P.L. Chebyshev, the value of the standard error of a simple random sample with a sufficiently large sample size (n) can be determined by the formula 
is standard error. From this formula for the average (standard) error of a simple random sample, it can be seen that the value depends on the variability of the trait in the general population (the greater the variation of the trait, the greater the sampling error) and on the sample size n (the more units are surveyed, the smaller the value of the discrepancies of the sample and general characteristics). Academician AM Lyapunov proved that the probability of a random sampling error with a sufficiently large size obeys the normal distribution law. This probability is determined by the formula 
In mathematical statistics, the confidence factor t is used, the values of the function F (t) are tabulated for its different values, and the corresponding levels of confidence are obtained (Table 6.1). Table 6.1 Confidence factor t and corresponding confidence levels 
The confidence coefficient allows you to calculate the marginal sampling error, 
i.e., the marginal sampling error is equal to t times the number of mean sampling errors. Thus, the value of the marginal sampling error can be set with a certain probability. As can be seen from the last column of Table. 6.1, the probability of an error being equal to or greater than three times the mean sampling error, i.e.
is extremely small and equal to 0,003(1-0,997). Such unlikely events are considered practically impossible, and therefore the value 
can be taken as the limit of possible sampling error. Sample observation makes it possible to determine the arithmetic mean of the sample population and the marginal error of this mean, which shows (with a certain probability) how much the sample value can differ from the general average up or down. Then the value of the general average will be represented by an interval estimate, for which the lower bound will be equal to 
The interval in which the unknown value of the estimated parameter will be enclosed with a given degree of probability is called the confidence interval, and the probability P is called the confidence probability. Most often, the confidence probability is taken equal to 0,95 or 0,99, then the confidence coefficient t is equal to 1,96 and 2,58, respectively. This means that the confidence interval contains the general mean with a given probability. Along with the absolute value of the marginal sampling error, the relative sampling error is also calculated, which is defined as the percentage of the marginal sampling error to the corresponding characteristic of the sampling population: 
The greater the value of the marginal sampling error, the greater the value of the confidence interval and, consequently, the lower the accuracy of the estimate. The average (standard) error of the sample depends on the sample size and the degree of variation of the trait in the general population. 6.3. Determining the required sample size One of the scientific principles in sampling theory is to ensure that a sufficient number of units are selected. Theoretically, the need to comply with this principle is presented in the proofs of the limit theorems of probability theory, which allow you to establish how many units should be selected from the general population so that it is sufficient and ensures the representativeness of the sample. A decrease in the standard error of the sample, and, consequently, an increase in the accuracy of the estimate is always associated with an increase in the sample size, therefore, already at the stage of organizing a sample observation, it is necessary to decide what the sample size should be in order to ensure the required accuracy of the observation results. The calculation of the required sample size is based on formulas derived from the formulas for marginal sampling errors (BUT), corresponding to one or another type and method of selection. So, for a random repeated sample size (n), we have: 
The essence of this formula is that with random re-selection of the required number, the sample size is directly proportional to the square of the confidence coefficient (t2) and the variance of the variation attribute (?eighteen) and inversely proportional to the square of the marginal sampling error (?2). In particular, by doubling the marginal error, the required sample size can be reduced by a factor of four. Of the three parameters, two (t and ?) set by the researcher. At the same time, the researcher, based on the goal and objectives of the sample survey should decide the question: in what quantitative combination is it better to include these parameters to provide the best option? In one case, he may be more satisfied with the reliability of the results obtained (t) than with the measure of accuracy (?), in the other - vice versa. It is more difficult to resolve the issue regarding the value of the marginal sampling error, since the researcher does not have this indicator at the stage of designing a sample observation, therefore, in practice, it is customary to set the marginal sampling error, as a rule, within 10% of the expected average level of the trait. Establishing an assumed average level can be approached in different ways: using data from similar earlier surveys, or using data from the sampling frame and taking a small pilot sample. The most difficult thing to establish when designing a sample observation is the third parameter in formula (5.2) - the variance of the sample population. In this case, it is necessary to use all the information available to the investigator, obtained from previous similar and pilot surveys. The question of determining the required sample size becomes more complicated if the sample survey involves the study of several features of sampling units. In this case, the average levels of each of the characteristics and their variation, as a rule, are different, and therefore it is possible to decide which dispersion of which of the characteristics to give preference to only taking into account the purpose and objectives of the survey. When designing a sample observation, a predetermined value of the permissible sampling error is assumed in accordance with the objectives of a particular study and the probability of conclusions based on the results of the observation. In general, the formula for the marginal error of the sample mean value allows you to determine: - the magnitude of possible deviations of the indicators of the general population from the indicators of the sample population; - the required sample size, providing the required accuracy, in which the limits of a possible error will not exceed a certain specified value; - the probability that the error in the sample will have a given limit. 6.4. Methods of selection and types of sampling In the theory of the sampling method, various methods of selection and types of sampling have been developed to ensure representativeness. Under the method of selection is understood the procedure for selecting units from the general population. There are two methods of selection: repeated and non-repeated. In the re-selection, each randomly selected unit after its examination is returned to the general population and, with subsequent selection, may again fall into the sample. This selection method is built according to the "returned ball" scheme: the probability of getting into the sample for each unit of the general population does not change regardless of the number of selected units. With non-repetitive selection, each unit selected at random, after its examination, is not returned to the general population. This method of selection is built according to the "unreturned ball" scheme: the probability of getting into the sample for each unit of the general population increases as the selection is made. Depending on the sampling methodology, the following main types of sampling are distinguished:
The actual random sample is formed in strict accordance with the scientific principles and rules of random selection. To obtain a proper random sample, the general population is strictly divided into sampling units, and then a sufficient number of units is selected in a random repeated or non-repetitive order. Random order is like drawing lots. In practice, it is most often used when using special tables of random numbers. If, for example, 1587 units should be selected from a population containing 40 units, then 40 four-digit numbers that are less than 1587 are selected from the table. In the case when the actual random sample is organized as a repeated one, the standard error is calculated in accordance with formula (6.1). With a non-repetitive sampling method, the formula for calculating the standard error will be: 
where 1 - n / N - the proportion of units of the general population that were not included in the sample. Since this proportion is always less than one, the error in non-repetitive selection, other things being equal, is always less than in repeated selection. Non-repetitive selection is easier to organize than repeated selection, and it is used much more often. However, the value of the standard error in non-repetitive sampling can be determined using a simpler formula (5.1). Such a replacement is possible if the proportion of units of the general population that are not included in the sample is large and, therefore, the value is close to one. Forming a sample in strict accordance with the rules of random selection is practically very difficult, and sometimes impossible, since when using tables of random numbers, it is necessary to number all units of the general population. Quite often, the general population is so large that it is extremely difficult and inexpedient to carry out such preliminary work, therefore, in practice, other types of samples are used, each of which is not strictly random. However, they are organized in such a way that the maximum approximation to the conditions of random selection is ensured. With a purely mechanical sample, the entire population of units must first of all be presented in the form of a list of units of selection, compiled in some neutral order with respect to the trait under study, for example, alphabetically. Then the list of sampling units is divided into as many equal parts as it is necessary to select units. Further, according to a predetermined rule, not related to the variation of the trait under study, one unit is selected from each part of the list. This type of sampling may not always provide a random selection, and the resulting sample may be biased. This is explained by the fact that, firstly, the ordering of the units of the general population may have an element of a non-random nature. Second, sampling from each part of the population, if the origin is incorrectly established, can also lead to a bias error. However, it is practically easier to organize a mechanical sample than a proper random one, and this type of sampling is most often used in sample surveys. The standard error for mechanical sampling is determined by the formula for the actual random non-repetitive sampling (6.2). Typical (zoned, stratified) sampling has two goals: - to ensure the representation in the sample of the corresponding typical groups of the general population according to the characteristics of interest to the researcher; - increase the accuracy of the sampling results. With a typical sample, before the start of its formation, the general population of units is divided into typical groups. In this case, a very important point is the correct choice of a grouping attribute. Selected typical groups may contain the same or different number of selection units. In the first case, the sampling set is formed with the same share of selection from each group, in the second - with a share proportional to its share in the general population. If the sample is formed with an equal share of selection, in essence it is equivalent to a number of properly random samples from smaller populations, each of which is a typical group. The selection from each group is carried out in a random (repeated or non-repeated) or mechanical order. With a typical sample, both with an equal and unequal selection share, it is possible to eliminate the influence of intergroup variation of the studied trait on the accuracy of its results, since it ensures the mandatory representation of each of the typical groups in the sample set. The standard error of the sample will not depend on the value of the total variance ?2, and on the value of the average of the group dispersions ?i2. Since the mean of the group variances is always less than the total variance, then, other things being equal, the standard error of a typical sample will be less than the standard error of a random sample itself. When determining the standard errors of a typical sample, the following formulas are used: - with a repeated selection method 
- with a non-repetitive selection method: 
- the average of the group variances in the sample population. Serial (nested) sampling is a type of sample formation when not the units to be surveyed, but groups of units (series, nests) are randomly selected. Within the selected series (nests), all units are examined. Serial sampling is practically easier to organize and conduct than the selection of individual units. However, with this type of sampling, firstly, the representation of each of the series is not ensured and, secondly, the influence of the interseries variation of the studied trait on the survey results is not eliminated. When this variation is significant, it will increase the random representativeness error. When choosing the type of sample, the researcher must take this circumstance into account. The standard error of serial sampling is determined by the formulas: - with a repeated selection method - 
where ? is the interseries variance of the sample; r is the number of selected series; - with a non-repeating method of selection - 
where R is the number of series in the general population. In practice, certain methods and types of sampling are used depending on the purpose and objectives of sample surveys, as well as the possibilities of organizing and conducting them. Most often, a combination of sampling methods and types of sampling is used. Such samples are called combined. Combination is possible in different combinations: mechanical and serial sampling, typical and mechanical, serial and actually random, etc. Combined sampling is used to ensure the greatest representativeness with the lowest labor and monetary costs for organizing and conducting the survey. With a combined sample, the value of the standard error of the sample consists of the errors at each of its steps and can be determined as the square root of the sum of the squares of the errors of the corresponding samples. So, if mechanical and typical sampling were used in combination with combined sampling, then the standard error can be determined by the formula 
where ?1 and ?2 are the standard errors of the mechanical and typical samples, respectively. A feature of a multi-stage sample is that the sample is formed gradually, according to the selection steps. At the first stage, units of the first stage are selected using a predetermined method and type of selection. At the second stage, from each unit of the first stage included in the sample, units of the second stage are selected, and so on. The number of stages may be more than two. At the last stage, a sample is formed, the units of which are subject to survey. So, for example, for a sample survey of household budgets, at the first stage, territorial subjects of the country are selected, at the second stage, districts in the selected regions, at the third stage, enterprises or organizations are selected in each municipality, and, finally, at the fourth stage, families are selected in the selected enterprises. . Thus, the sampling set is formed at the last stage. Multi-stage sampling is more flexible than other types, although in general it gives less accurate results than a single-stage sample of the same size. However, at the same time, it has one important advantage, which is that the sampling frame in multi-stage selection needs to be built at each stage only for those units that are in the sample, and this is very important, since there is often no ready-made sampling frame. The standard error of sampling in multi-stage selection with groups of different volumes is determined by the formula 
where ?1, ?2, ?3, ... - standard errors at different stages; n1, n2, n3, ... - the number of samples at the corresponding stages of selection. In the event that the groups are not the same in volume, then theoretically this formula cannot be used. But if the total proportion of selection at all stages is constant, then in practice the calculation by this formula will not lead to a distortion of the error. The essence of a multi-phase sample is that, based on the initially formed sample, a sub-sample is formed, from this sub-sample - the next sub-sample, etc. The initial sample is the first phase, the sub-sample from it is the second, etc. It is advisable to use a multi-phase sample in cases where:
One of the undoubted advantages of multi-phase sampling is the fact that the information obtained in the first phase can be used as additional information in subsequent phases, the information of the second phase can be used as additional information in subsequent phases, etc. This use of information increases the accuracy of the results of the sample survey. . When organizing a multi-phase sampling, a combination of various methods and types of selection can be used (typical sampling with mechanical sampling, etc.). Multi-phase selection can be combined with multi-stage. At each stage, the sampling can be multi-phase. The standard error in a multi-phase sample is calculated for each phase separately in accordance with the formulas of the selection method and type of sample, with the help of which its sample was formed. Interpenetrating samples are two or more independent samples from the same general population, formed by the same method and type. It is advisable to resort to interpenetrating samples if it is necessary to obtain preliminary results of sample surveys in a short time. Interpenetrating samples are effective for evaluating survey results. If the results are the same in independent samples, then this indicates the reliability of the sample survey data. Interpenetrating samples can sometimes be used to test the work of different researchers by having each researcher conduct a different sample survey. The standard error for interpenetrating samples is determined by the same formula as typical proportional sampling (5.3). Interpenetrating samples require more labor and money than other types, so the researcher must take this into account when designing a sample survey. The marginal errors for various selection methods and types of sampling are determined by the formula ? = t?, where? is the corresponding standard error. Topic 7. INDEX ANALYSIS 7.1. General concept of indices and index method In the practice of statistics, indices, along with averages, are the most common statistical indicators. With their help, the development of the national economy as a whole and its individual sectors is characterized, the role of individual factors in the formation of the most important economic indicators is studied, the indices are also used in international comparisons of economic indicators, determining the standard of living, monitoring business activity in the economy, etc. The index (Latin index) is a relative value showing how many times the level of the phenomenon under study under given conditions differs from the level of the same phenomenon in other conditions. Differences in conditions can manifest themselves in time (indices of dynamics), in space (territorial indices) and in the choice of some conditional level as a basis for comparison. According to the coverage of the elements of the population (its objects, units and their characteristics), individual (elementary) and summary (complex) indices are distinguished, which in turn are divided into general and group. Individual indices are the result of comparing two indicators related to the same object, for example, comparing the prices of a product, the volume of its sale, etc. In the statistical and economic analysis of the activities of enterprises and industries, individual indices of qualitative and quantitative indicators are widely used. On the- For example, the price index ip = P1 / P0 characterizes the relative change in the unit price level of each type of product in the reporting period compared to the base one and is a qualitative indicator. The physical volume index iq = q1 / q2 shows how many times the production of this type of product has changed in the reporting period in relation to the period with which the comparison was made, and is a quantitative indicator. The composite index characterizes the ratio of the levels of several elements of the population (for example, a change in the volume of output of several types of products that have a different natural-material form, or a change in the level of labor productivity in the production of several types of products). If the population under study consists of several groups, then the composite indices, each of which characterizes the change in the levels of a separate group of units, are group (sub-indices), and the composite index, covering the entire population of units, is a general (total) index. Composite indices express the ratio of complex socio-economic phenomena and consist of two parts: an indexed value and a commensurate, which is called weight. The indicator, the change of which characterizes the index, is called indexed. Indexed indicators can be of two kinds. Some of them measure the general, total size (volume) of a particular phenomenon and are conditionally called volumetric, extensive (physical volume of products of a given type, number of employees, total labor costs for production, total cost of production, etc.). These indicators are obtained as a result of direct calculation or summation and are initial, primary. Other indicators measure the level of a phenomenon or feature in terms of one or another unit of the population and are conditionally called qualitative, intensive: output per unit of time (or per employee), labor time per unit of output, unit cost of production, etc. These indicators are obtained by dividing volumetric indicators, i.e., they are of a calculated, secondary nature. They measure the intensity, effectiveness of a phenomenon or process and, as a rule, are either average or relative values. When using the index method, a certain symbolism is applied, i.e., a system of conventions. Each indexed indicator is indicated by a specific letter (usually Latin). Let us introduce the following notation: Q - the quantity (volume) of manufactured products (or the quantity of goods sold) of this type in physical terms; T - the total cost of working time (labor) for the production of this type of product, measured in man-hours or man-days; in some cases, the same letter indicates the average payroll number of employees; z - unit cost of production; t is the labor intensity of a unit of production; p is the price of a unit of production or goods; - the total consumption of raw materials, material or fuel for the production of products of a given type and volume. Indicators for the base period have a subscript "0" in the formulas, and for the compared (current, reporting) period - the sign "1". Individual indices are denoted by the letter i and are also provided with a subscript - the designation of the indexed indicator. So, iQ means an individual index of the quantity (physical volume) of manufactured products (or goods sold) of a given type; iz - individual unit cost index of a given type of product, etc. Composite indices are denoted by the letter I and are also accompanied by subscript indicators of the indicators whose change they characterize. For example, It is a composite index of labor intensity of a unit of production, etc. Individual indices are ordinary relative values, that is, they can be called indices only in the broad sense of this term. Indices in the narrow sense, or indices proper, are also relative indicators, but of a special kind. They have a more complex method of construction and calculation, and the specific methods of their construction are the essence of the index method. Socio-economic phenomena and indicators characterizing them can be commensurate, that is, have a common measure, and incommensurable. Thus, the volume of products or goods of the same type and variety produced at different enterprises or sold in different stores are commensurate and can be summed up, while the volumes of different types of products or goods are incommensurable and cannot be directly summed up. It is impossible, for example, to add kilograms of bread with liters of milk, meters of cloth and pairs of shoes. The incommensurability and impossibility of direct summation in the construction and calculation of the composite index is explained here not so much by the difference in natural units of measurement, but by the difference in consumer properties, the unequal natural-material form of these products or goods. In this regard, in order to calculate composite indices, it is necessary to bring their constituent parts to a comparable form. The unity of different types of products or different goods lies in the fact that they are products of labor, have a certain value and its monetary expression - the price (p). Each product also has a particular cost (z) and labor intensity (t). These qualitative indicators can be used as a general measure - the coefficients of comparison of heterogeneous products. Multiplying the volume of production of each type (Q) by the corresponding price, cost or labor intensity of a unit of production, we will reduce the various products to the same unity and obtain comparable indicators. The situation is similar when constructing composite indexes of qualitative indicators. Suppose, for example, we are interested in the change in the general price level of the various goods sold. Although formally the prices of different commodities are commensurable, however, their direct summation, without taking into account the quantity of goods sold of each type, gives a value devoid of independent practical significance. Therefore, the composite price index cannot be constructed as a ratio of simple sums: ip = ?p1/?p2. The prices of individual goods do not take into account the specific number of goods sold and their statistical weight and role in the process of commodity circulation. Simple sums of prices of individual goods are not suitable for constructing a composite index, also because prices depend on the unit of measurement of goods, the change of which will give other amounts and a different index value. Consequently, when constructing composite indices of qualitative indicators, they cannot be considered in isolation from the volumetric indicators associated with them, per unit of which these qualitative indicators are calculated. Only by multiplying one or another qualitative indicator (p, z, t) by a volume indicator directly related to them (Q), we can take into account the role and statistical weight of each type of product (or product) in a particular economic process - the process of formation of the total value (pQ), the total cost (zQ), the total cost of working time (tQ), etc. At the same time, we will obtain indicators whose summation is of practical importance. Thus, the first feature of the index method and the indices themselves is that the indexed indicator is not considered in isolation, but in conjunction with other indicators. By multiplying the indexed indicator by another, related to it, we reduce various phenomena to their unity, ensure their quantitative comparability and take into account their weight in the real economic process. Therefore, multiplier indicators associated with indexed indicators are usually called weights of indices, and multiplication by them is called weighting. However, multiplying the values of an indexed indicator by the values of another indicator (weight) associated with them does not yet solve the problem of the index itself. By multiplying, for example, the prices by the quantities of commodities corresponding to them, we will find the value of these commodities in each period and thereby solve the problem of commensuration and weighting. However, a comparison of the resulting sums of products (?p1Q1 and ?p0Q0) gives an indicator that characterizes the change in trade turnover, which depends on two factors - prices and quantity (volume) of goods, but does not characterize changes in the price level and the level of production of goods: 
In order for the index to characterize the change in only one factor, it is necessary to eliminate the change in the other factor in formula (7.1), fixing it both in the numerator and in the denominator at the level of the same period. For example, to estimate the volume of heterogeneous products in two compared periods, it is necessary to evaluate goods sold in both periods at the same, for example, basic, prices (p0). The resulting indicator will reflect the change in only one factor - the physical volume of production Q: 
And to assess the change in the price level for a group of goods, it is necessary to compare the same volumes of these goods, i.e., the number of goods (Q) should be fixed both in the numerator and in the denominator of the index at the same level (either at the base or at the reporting level). Thus, the constructed composite price indices will characterize only the change in prices, i.e., the indexed indicator, since the change in weights (Q) will be eliminated (eliminated) due to their fixation: Ip =?p1q1/?p0q1; IP=?p1q0/?p0q0. In both cases (Iq and Ip), the index reflected the change in only one factor - the indexed indicator due to the fixation of the other (weights) at the same level. Eliminating the influence of changing weights by fixing them in the numerator and denominator of the index at the same level is the second feature of indices and the index method. Considering the problems that arise in the construction of the actual indices, the task was to give a comparative description of the levels of a complex phenomenon consisting of heterogeneous elements (different types of products, etc.). So, Ip should show how the price level has changed in general, that is, measure the price dynamics of various goods in the form of one generalizing indicator. Historically, the indices themselves appeared as a result of solving this particular economic task - the task of generalizing, synthesizing the dynamics of individual elements of a complex phenomenon in one generalizing indicator, a composite index. However, the indices themselves are used to solve another problem - the analysis of the influence of changes in individual indicators-factors on the change in an indicator representing a function of these factors-arguments. So, the total cost of goods sold (turnover - ?pq) is a function of their prices (p) and quantities (volumes - Q), so you can set the task to measure the impact of each of these factors on the change in turnover, i.e. to determine how it has changed separately by changing each factor. Indices used to solve such analytical problems are also built using the specific features of the index method - weighting and elimination of weight changes. Thus, the index itself is a relative indicator of a special kind, in which the levels of a socio-economic phenomenon are considered in connection with another (or other) phenomenon, the change of which is eliminated in this case. Indicators associated with the indexed indicator are used as index weights, and weighting and elimination of weight changes (fixing in the numerator and denominator of the index at the same level) are the specifics of the indices themselves and the index method. 7.2. Aggregate indices of qualitative indicators Each qualitative indicator is associated with one or another volume indicator, based on the unit of measurement of which it is calculated (or to the unit of measurement of which it refers). Thus, the unit price of a good is related to its quantity (Q); quality indicators such as price (p), cost (z) and labor intensity (t = T / Q) of a unit of production, as well as the specific consumption of raw materials and materials (m = M / Q) are associated with the volume of manufactured products. Composite indices of quality indicators should not characterize their change in general in relation to any arbitrary set of goods or products, but the change in prices, prime cost, labor intensity or unit costs of a completely certain amount of goods produced or goods sold. This is achieved by weighting - multiplying the levels of the indexed qualitative indicator by the values of the volume indicator (weight) associated with it - and fixing the weights in the numerator and denominator of the index at the same level. Comparison of the sums of such products gives an aggregate index. Similarly, aggregate indices of the dynamics of the cost and labor intensity of a unit of production, as well as the index of the specific consumption of raw materials or materials, can be constructed. The main problem in constructing these composite indices is the economically justified choice of the level at which it is necessary to fix the weights of the index, i.e., in this case, the volume of production (or goods) - Q. Usually, before the composite index of the dynamics of a qualitative indicator, the task is to measure not only the relative change in the level, but also the absolute value of the economic effect that is obtained in the current period as a result of this change: the amount of savings for buyers due to price reductions (or the amount of their additional costs, if prices increased), the amount of savings (or additional costs) due to changes in cost, etc. This formulation of the problem leads to indices of the dynamics of qualitative indicators with weights of the current period: - firstly, the researcher is interested in changing the cost or labor intensity of the products that are currently produced, and not in the past; - secondly, the economic effect should be linked to the actual results of the current, reporting, and not the previous (base) period. Let's take the aggregate cost index as an example: 
Thus, in this index, the numerator is the sum of actual costs for products in the reporting period, and the denominator is a conditional value that shows how much money would be spent on products in the reporting period if the unit cost of each type of product remained at the base level. The real economic effect obtained by changing the unit cost of production is expressed as an absolute value, which is calculated as the difference between the amounts in the numerator and denominator of the index: (?z1Q1 ??z0Q1) or (? z1?z0 Q1). Therefore, weighting by the weights of the reporting (current) period links the index of the qualitative indicator with the indicator of the economic effect, which is obtained by changing the indexed indicator. Therefore, aggregate indexes! dynamics of qualitative indicators are built and calculated usually with the weights of the reporting period: 
Formula (7.2) is the composite price index, and formula (7.3) is the calculation of the composite index of material consumption. In these indices, the difference between the numerator and denominator characterizes in the first case a decrease or increase in the cost of acquiring the same set of goods, depending on the sign of the difference; in the second case - an increase or decrease in the consumption of materials for the production of the same volume of products. 7.3. Aggregate indices of volume indicators Volumetric indicators can be commensurate (T, pQ, zQ) and incommensurable (the volume of products or goods of various types - Q). Comparable volume indicators can be directly summed up, and the construction of aggregate indices does not cause difficulties. To obtain a general result and build an aggregate index of a disparate volume indicator, it is necessary to first measure the individual values of this indicator. Based on the economic essence of the phenomenon, it is necessary to find a common measure and use it as a coefficient of comparison. Such a common measure for volume indicators is the associated qualitative indicators. Thus, the volumes of various types of products can be measured using the price (p), cost (z) and labor intensity (t) of these products. By multiplying the indexed volume indicator by one or another qualitative indicator, not only is the possibility of summation possible, but at the same time the role of each element, for example, a product, in the real economic process, i.e., its statistical weight in this process, is also taken into account. Since various qualitative indicators can act as weights in the volume index, the question arises as to which of them should be used. This issue in each specific case must be resolved in accordance with the cognitive economic task that is put before the index, i.e., the choice of certain weights-commensurators must be economically justified. In the practice of economic and statistical work, prices are usually used as weights for the aggregate index of output. This is how indices of the volume of industrial and agricultural products are built, as well as indices of the physical volume of trade. In a number of cases, a change in the volume of production is of interest not in itself, but from the point of view of its influence on a change in an indicator of a more complex order: the total cost of production, its total cost, the total cost of working time, the total volume of production in a given section of it, etc. In such cases, the choice of weights-components is determined by the relationship of indicators-factors on which a more complex indicator depends. In order for the index to reflect only the change in the indexed volume indicator, the weights in its numerator and denominator are fixed at the level of the same period. In the practice of economic work in the indices of the dynamics of volume indicators, the weights are usually fixed at the level of the base period (see formula 7.2). This makes it possible to build systems of interconnected indexes. For individual volume indicators (sales volume, productivity volume, sown area), the weights are selected at the level of the base period. For example: 
where In is the composite yield index; I - composite index of the cost of trade; Iq - composite cost index. Unlike qualitative indexes, which are calculated on a comparable range of units (comparable products), composite volume indexes, for the sake of completeness and accuracy, should cover the entire range of units produced (or sold) in each period. In this regard, the question arises of what weights should be taken for those types of products that were not produced in one of the compared periods. In the practice of statistics in such cases, two methods are used. When calculating indices of the volume of industrial output, new types of industrial output for which there are no prices of the base period are estimated conditionally at the prices of the current period. When calculating the indices of the volume of goods sold, a method is used based on the conditional assumption that the prices for new goods have changed to the same extent as the prices for the compared range of similar goods. 7.4. Series of aggregate indices with constant and variable weights When studying the dynamics of economic phenomena, indices are built and calculated for a number of successive periods. They form a series of either basic or chain indices. In the series of basic indices, the indexed indicator in each index is compared with the level of the same period, and in the series of chain indices, the indexed indicator is compared with the level of the previous period. In each individual index, the weights in its numerator and denominator are necessarily fixed at the same level. If a series of indices is being built, then the weights in it can be either constant for all indices of the series, or variable. A number of basic indices of production volume ?q1p0/?q0p0,?q2p0/?q0p0,?q3p0/?q0p0, etc. have constant weights (р0). A number of chain indices also have constant weights (p0): ?q1p0/?q0p0,?q2p0/?q1p0,?q3p0/?q2p0, etc. A number of chain price indices ?p1q1/?p1q0,?p2q2/?p2q0, ?p3q3 /?p3q2, etc. are built with variable weights (in the 1st index - q1 in the 2nd - q2, etc.) . For dynamics indices with constant weights, the relationship between chain and basic growth rates (indices) is valid: 
Thus, the use of constant weights over a number of years makes it possible to move from chain indices to basic ones, and vice versa. Therefore, the series of indices for the volume of production and the volume of goods sold are constructed in statistical practice with constant weights. For example, in output volume indices, prices fixed at the level that was set on January 1 of a base year are used as constant weights. Such prices, used for a number of years, are called comparable (fixed). The use of comparable prices in the indices of the volume of production (goods) makes it possible, by simple summation, to obtain results for several years. Comparable prices should not differ greatly from the current (current) prices, therefore they are periodically reviewed, moving to new comparable prices. In order to be able to calculate production volume indices for long periods during which different comparable prices were applied, the production of one year is valued both at the old and at the new fixed prices. The index for a long period is calculated by the chain method, that is, by multiplying the indices for individual segments of this period. The series of indexes of qualitative indicators, which are economically correct to weigh according to the weights of the current period, are constructed with variable weights. 7.5. Construction of consolidated territorial indices When constructing territorial indices, i.e., when comparing indicators in space (inter-district, comparison between different enterprises, etc.), questions arise about the choice of a comparison base and a region (object) at the level of which the index weights should be fixed. In each specific case, these issues need to be addressed based on the objectives of the study. The choice of the comparison base depends, in particular, on whether the comparisons will be bilateral (for example, comparing the indicators of two neighboring territorial units) or multilateral (comparing the indicators of several territories, objects). In two-sided comparisons, each territory or object with the same basis can be taken both as a comparison and as a comparison base. In this regard, the question arises of fixing the weights of the composite index at the level of a particular region (object). Suppose, for example, it is necessary to determine in which of the two areas and by how many percent the unit cost of production is lower and the volume of its production is greater. If we compare area A with area B, a fairly reasonable and simple way is to fix the production volumes in general for both territories (Q = QA + QB) in the cost index as weights, then we get: Iz =?zQ/?zQ . With multilateral comparisons, for example, when comparing qualitative indicators in several areas, it is necessary to expand the boundaries of the territory at the level of which the weights are fixed accordingly. In the consolidated territorial indices of volume indicators, the average levels of the corresponding qualitative indicators calculated as a whole for the compared territories can be taken as weights. So, in our example 
7.6. Average indices Depending on the methodology for calculating individual and composite indices, there are arithmetic mean and mean harmonic indices. In other words, the overall index, built on the basis of the individual index, takes the form of an arithmetic average or harmonic index, i.e. it can be converted into an arithmetic average and an average harmonic index. The idea of constructing a composite index as an average of individual (group) indices is quite understandable: after all, the composite index is a general measure that characterizes the average change in the indexed indicator, and, of course, its value should depend on the values of individual indices. And the criterion for the correctness of constructing a composite index in the form of an average value (average index) is its identity to the aggregate index. The transformation of the aggregate index into the average of the individual (group) indices is carried out as follows: either in the numerator or in the denominator of the aggregate index, the indexed indicator is replaced by its expression in terms of the corresponding individual index. If such a replacement is made in the numerator, then the aggregate index will be converted into the arithmetic mean, if in the denominator, then into the harmonic mean of the individual indices. For example, the individual index of physical volume iq = q1/q0 and the cost of production of each type in the base period (q0p0) are known. The initial base for constructing the average of individual indices is the composite index of physical volume: 
(aggregate form of the Laspeyres index). From the available data, only the denominator of the formula can be obtained directly by summation. The numerator can be obtained by multiplying the cost of an individual type of product of the base period by an individual index: 
Then the formula of the composite index will take the form: 
i.e., we obtain the arithmetic average index of physical volume, where the weights are the cost of individual types of products in the base period. Let's assume that there is information on the dynamics of the volume of output of each type of product (r^) and the cost of each type of product in the reporting period (p1q1). To determine the total change in the output of an enterprise in this case, it is convenient to use the Paasche formula: 
The numerator of the formula can be obtained by summing the q1P1 values, and the denominator by dividing the actual cost of each type of product by the corresponding individual index of the physical volume of production, i.e. by dividing: p1q1 / iq , then: 
thus, we obtain the formula for the average weighted harmonic index of physical volume. The use of one or another formula for the index of physical volume (aggregate, arithmetic mean and harmonic mean) depends on the information available. You also need to keep in mind that the aggregate index can be converted and calculated as an average of individual indices only if the list of types of products or goods (their range) in the reporting and base periods coincides, i.e. when the aggregate index is built on a comparable range of units ( aggregate indices of qualitative indicators and aggregate indices of volume indicators, subject to a comparable assortment). Topic 8. ANALYSIS OF DYNAMICS 8.1. The dynamics of socio-economic phenomena and the tasks of its statistical study The phenomena of social life studied by socio-economic statistics are in continuous change and development. Over time - from month to month, from year to year - the size of the population and its composition, the volume of production, the level of labor productivity, etc., change, so one of the most important tasks of statistics is to study the change in social phenomena over time - the process of their development, their dynamics. Statistics solves this problem by constructing and analyzing time series (time series). A series of dynamics (chronological, dynamic, time series) is a sequence of numerical indicators ordered in time that characterize the level of development of the phenomenon under study. The series includes two mandatory elements: time and the specific value of the indicator (series level). Each numerical value of the indicator, characterizing the magnitude, the size of the phenomenon, is called the level of the series. In addition to levels, each series of dynamics contains indications of those moments or periods of time to which the levels refer. When summing up the results of statistical observation, absolute indicators of two types are obtained. Some of them characterize the state of the phenomenon at a certain point in time: the presence at that moment of any units of the total density or the presence of one or another volume of a feature. Such indicators include the population, car fleet, housing stock, commodity stocks, etc. The value of such indicators can be determined directly only as of a particular point in time, and therefore these indicators and the corresponding time series are called momentary. Other indicators characterize the results of any process for a certain period (interval) of time (day, month, quarter, year, etc.). Such indicators are, for example, the number of births, the number of products manufactured, the commissioning of residential buildings, the wage fund, etc. The value of these indicators can only be calculated for some interval (period) of time, therefore such indicators and their series of values are called interval . Some features (properties) of the levels of the corresponding time series follow from the different nature of the interval and moment absolute indicators. In the interval series, the value of the level, which is the result of any process for a certain interval (period) of time, depends on the duration of this period (length of the interval). Other things being equal, the level of the interval series is the greater, the longer the length of the interval to which this level belongs. In moment series of dynamics, where there are also intervals - time intervals between adjacent dates in a series - the value of a particular level does not depend on the duration of the period between adjacent dates. Each level of the interval series is already the sum of levels for shorter periods of time. At the same time, the population unit, which is part of one level, is not included in other levels, therefore, in the interval series of dynamics, the levels for adjoining time periods can be summed up, obtaining results (levels) for longer periods (thus, summing up the monthly levels, we get quarterly, summing quarterly, we get annual, summing annual - multi-year). Sometimes, by sequentially adding the levels of the interval series for adjacent time intervals, a series of cumulative totals is constructed, in which each level represents the total not only for a given period, but also for other periods, starting from a certain date (from the beginning of the year, etc.) .). Such cumulative results are often given in the accounting and other reports of enterprises. In a moment time series, the same units of the population are usually included in several levels, so summing up the levels of the moment series of dynamics in itself does not make sense, since the results obtained in this case are devoid of independent economic significance. Above we spoke about the series of dynamics of absolute values, which are initial, primary. Along with them, series of dynamics can be constructed, the levels of which are relative and average values. They can also be either momentary or interval. In the interval series of the dynamics of relative and average values, the direct summation of the levels in itself is meaningless, since the relative and average values are derivatives and are calculated by dividing other values. When constructing and before analyzing a series of dynamics, it is necessary first of all to pay attention to the fact that the levels of the series are comparable with each other, since only in this case the dynamic series will correctly reflect the process of development of the phenomenon. The comparability of the levels of a series of dynamics is the most important condition for the validity and correctness of the conclusions obtained as a result of the analysis of this series. When constructing a time series, it must be borne in mind that the series can cover a large period of time during which changes could occur that violate comparability (territorial changes, changes in the scope of objects, calculation methodology, etc.). When studying the dynamics of social phenomena, statistics solves the following tasks: - measures the absolute and relative rate of growth or decrease in the level for separate periods of time; - gives general characteristics of the level and the rate of its change for a given period; - reveals and numerically characterizes the main trends in the development of phenomena at individual stages; - gives a comparative numerical characteristic of the development of this phenomenon in different regions or at different stages; - reveals the factors causing change of the studied phenomenon in time; - makes forecasts of the development of the phenomenon in the future. 8.2. The main indicators of the series of dynamics When studying dynamics, various indicators and methods of analysis are used, both elementary, simpler, and more complex, requiring, accordingly, the use of more complex sections of mathematics. The simplest indicators of analysis that are used in solving a number of problems, primarily when measuring the rate of change in the level of a series of dynamics, are absolute growth, growth and growth rates, as well as the absolute value (content) of one percent growth. The calculation of these indicators is based on comparing the levels of a series of dynamics with each other. At the same time, the level with which the comparison is made is called the base level, since it is the base of comparison. Usually, either the previous level or some previous level, for example, the first level of a series, is taken as the base of comparison. If each level is compared with the previous one, then the indicators obtained in this case are called chain indicators, since they are, as it were, links in the "chain" connecting the levels of the series. If all levels are associated with the same level, which acts as a constant base of comparison, then the indicators obtained in this case are called basic. Often, the construction of a series of dynamics begins with the level that will be used as a constant base of comparison. The choice of this base should be justified by the historical and socio-economic features of the development of the phenomenon under study. It is advisable to take some characteristic, typical level as the basic one, for example, the final level of the previous stage of development (or its average level, if at the previous stage the level either increased or decreased). The absolute increase shows how many units the level has increased (or decreased) compared to the baseline, that is, for a given period (period) of time. The absolute increase is equal to the difference between the compared levels and is measured in the same units as these levels: ? =yi?yi?1; ? =yi ?y0 , where yi is the level of the i-th year; yi-1 - level of the previous year; y0 - base year level. If the level has decreased compared to the baseline, then ? ‹0; it characterizes the absolute decrease in the level. Absolute growth per unit of time (month, year) measures the absolute rate of growth (or decline) of the level. Chain and basic absolute growths are interconnected: the sum of successive chain growths is equal to the corresponding basic growth, i.e., the total growth for the entire period. A more complete characterization of growth can only be obtained when absolute values are supplemented by relative ones. Relative indicators of dynamics are growth rates and growth rates that characterize the intensity of the growth process. The growth rate (Tr) is a statistical indicator that reflects the intensity of changes in the levels of a series of dynamics and shows how many times the level has increased compared to the baseline, and in case of a decrease, what part of the baseline is the compared level; measured by the ratio of the current level to the previous or base: 
Like other relative values, the growth rate can be expressed not only in the form of a coefficient (a simple ratio of levels), but also as a percentage. Like absolute growth rates, growth rates for any time series are in themselves interval indicators, i.e. they characterize one or another period (interval) of time. There is a certain relationship between chain and base growth rates, expressed in the form of coefficients: the product of successive chain growth rates is equal to the base growth rate for the entire corresponding period, for example: y2/ y1 y3/ y2 = y3/ y1. The growth rate (Tpr) characterizes the relative growth rate, i.e., it is the ratio of absolute growth to the previous or base level: 
The growth rate, expressed as a percentage, shows how many percent the level has increased (or decreased) compared to the baseline, taken as 100%. When analyzing the rates of development, one should never lose sight of what absolute values - levels and absolute increments - are hidden behind the rates of growth and growth. In particular, it should be borne in mind that with a decrease (deceleration) in growth and growth rates, absolute growth may increase. In this regard, it is important to study another indicator of dynamics - the absolute value (content) of 1% growth, which is determined as the result of dividing the absolute growth by the corresponding growth rate: 
This value shows how much in absolute terms each percentage of growth gives. Sometimes the levels of the phenomenon for one year are not comparable with the levels for other years due to territorial, departmental and other changes (changes in the methodology of accounting and calculation of indicators, etc.). To ensure comparability and obtain a time series suitable for analysis, it is necessary to directly recalculate levels that are incomparable with others. However, sometimes the data required for this is not available. In such cases, you can use a special technique called the closure of the series of dynamics. Let, for example, there was a change in the boundaries of the territory over which the dynamics of the development of some phenomenon was studied in the i-th year. Then the data obtained before this year will not be comparable with the data for subsequent years. In order to close these series and to be able to analyze the dynamics of the series for the entire period, we will take in each of them as the comparison base the level of the i-th year, for which there are data both in the old and in the new boundaries of the territory. These two rows with the same base of comparison can then be replaced by one closed dynamics row. From the data of a closed series, one can calculate the growth rate compared to any year, one can also calculate the absolute levels for the entire period within the new boundaries. Nevertheless, it must be borne in mind that the results obtained by closing the series of dynamics contain some error. Graphically, the dynamics of phenomena is most often depicted in the form of bar and line charts. Other forms of charts are also used: curly, square, sector, etc. Analytical charts are usually built in the form of line charts. 8.3. Average dynamics Over time, not only the levels of phenomena change, but also the indicators of their dynamics - absolute increments and rates of development, therefore, for a generalizing characteristic of development, to identify and measure typical main trends and patterns, and to solve other problems of analysis, average indicators of the time series are used - average levels, average absolute gains and average rates of dynamics. It is often necessary to resort to the calculation of the average levels of a series of dynamics already when constructing a time series - to ensure the comparability of the numerator and denominator when calculating average and relative values. Let, for example, you need to build a series of dynamics of electricity production per capita in the Russian Federation. To do this, for each year it is necessary to divide the amount of electricity produced in a given year (interval indicator) by the population in the same year (a momentary indicator, the value of which changes continuously throughout the year). It is clear that the size of the population at one point or another in the general case is not comparable with the volume of production for the entire year as a whole. To ensure comparability, it is also necessary to somehow date the population to the entire year, and this can be done only by calculating the average population for the year. It is often necessary to resort to average indicators of dynamics also because the levels of many phenomena fluctuate greatly from period to period, for example, from year to year, either increasing or decreasing. This is especially true for many indicators of agriculture, where there is no year for the year, therefore, when analyzing the development of agriculture, they often operate not with annual indicators, but with more typical and stable average annual indicators for several years. When calculating average indicators of dynamics, it must be borne in mind that the general provisions of the theory of average values fully apply to these average indicators. This means, first of all, that the dynamic average will be typical if it characterizes a period with homogeneous, more or less stable conditions for the development of the phenomenon. The allocation of such periods - stages of development - is in a certain respect analogous to grouping. If the dynamic average value is calculated for a period during which the conditions for the development of the phenomenon changed significantly, i.e., a period covering different stages of the development of the phenomenon, then such an average value must be used with great care, supplementing it with average values for individual stages. The average indicators of dynamics must also satisfy the logical and mathematical requirement, according to which, when replacing the actual values from which the average is obtained, the value of the defining indicator, i.e., some generalizing indicator associated with the averaged indicator, should not change. The method for calculating the average level of a series of dynamics depends primarily on the nature of the indicator underlying the series, i.e., on the type of time series. The most simple way is to calculate the average level of the interval series of the dynamics of absolute values with equal levels. The calculation is made according to the formula of a simple arithmetic average: 
where n is the number of actual levels for successive equal time intervals. The situation is more complicated with the calculation of the average level of the moment series of the dynamics of absolute values. The momentary indicator can change almost continuously, so the more detailed and comprehensive the data on its change, the more accurately you can calculate the average level. Moreover, the calculation method itself depends on how detailed the available data are. Various cases are possible here. In the presence of comprehensive data on the change in the moment indicator, its average level is calculated by the formula of the arithmetic weighted average for an interval series with different levels: 
where t is the number of time periods during which the level did not change. If the time intervals between adjacent dates are equal to each other, i.e. when we are dealing with equal (or approximately equal) intervals between dates (for example, when the levels are known at the beginning of each month or quarter, year), then for a moment series with equidistant levels, we calculate the average level of the series using the chronological average formula: 
For a moment series with different levels, the average level of the series is calculated using the formula 
Above, we spoke about the average level of the series of dynamics of absolute values. For the series of dynamics of average and relative values, the average level must be calculated based on the content and meaning of these average and relative indicators. The average absolute increase shows how many units the level increased or decreased compared to the previous period on average per unit of time (on average, monthly, annually, etc.). The average absolute increase characterizes the average absolute rate of growth (or decline) of the level and is always an interval indicator. It is calculated by dividing the total growth for the entire period by the length of this period in various units of time: - calculation of the average absolute chain growth: 
- calculation of the average absolute basic increase: 
where - chain absolute increments for successive periods of time; n is the number of chain increments; Y0 - the level of the base period. As a basis and criterion for the correctness of calculating the average growth rate (as well as the average absolute increase), one can use the product of chain growth rates, which is equal to the growth rate for the entire period under consideration, as a determining indicator. Thus, multiplying n chain growth rates, we get the growth rate for the entire period: 
Let us set the task of finding such an average growth rate (p) that, when it replaces the actual chain rates in formula 8.11, the growth rate for the entire period (y1 / y1 -1) remains unchanged. Therefore, the equality 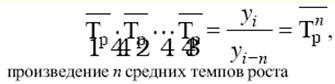
from which follows: 
where n is the number of levels of the dynamics series; T1, T2, Tp - chain growth rates. Formula (8.1) is called the simple geometric mean, (8.2) the implicit geometric mean. The average growth rate, expressed in the form of a coefficient, shows how many times the level increases compared to the previous period on average per unit of time (on average annually, monthly, etc.). For average growth and growth rates, the same relationship holds that holds between normal growth and growth rates: 
The average rate of growth (or decline), expressed as a percentage, shows how many percent the level increased (or decreased) compared to the previous period on average per unit of time (on average annually, monthly, etc.). The average growth rate characterizes the average intensity of growth, i.e., the average relative rate of level change. Of the two types of the formula for the average growth rate, formula (8.2) is more often used, since it does not require the calculation of all chain growth rates. According to formula (8.1), it is advisable to calculate only in cases where neither the levels of the series of dynamics, nor the growth rate for the entire period are known, but only chain growth rates (or growth) are known. 8.4. Identification and characterization of the main development trend One of the tasks that arise in the analysis of time series is to establish patterns of change in the levels of the indicator under study over time. To do this, it is necessary to single out such periods (stages) of development that are sufficiently homogeneous in relation to the relationship of this phenomenon with others and the conditions for its development. Identification of stages of development is a task at the intersection of science that studies this phenomenon (economics, sociology, etc.) and statistics. The solution of this problem is carried out not only and even not so much with the help of statistical methods (although they can be of some benefit), but on the basis of a meaningful analysis of the essence, nature of the phenomenon and the general laws of its development. For each stage of development, it is necessary to identify and numerically characterize the main trend in changing the level of the phenomenon. A trend is understood as a general direction towards an increase, decrease or stabilization of the level of a phenomenon over time. If the level is continuously increasing or continuously decreasing, then the upward or downward trend is clearly observed: it is easily detected visually on the time series graph. However, it should be borne in mind that both growth and decrease in the level can occur in different ways: either evenly, or accelerated, or slowed down. Uniform growth (or decline) is understood as growth (or decline) at a constant absolute rate, when the chain absolute increments (;) are the same. With accelerated growth or decline, chain increments systematically increase in absolute value, and with slow growth or decline, they decrease (also in absolute value). In practice, the levels of a series of dynamics very rarely grow (or decrease) strictly evenly. Infrequently, there is also a systematic, without a single deviation, an increase or decrease in chain increments. Such deviations are explained either by a change in the course of time of the whole complex of the main causes and factors on which the level of the phenomenon depends, or by a change in the direction and strength of the action of secondary, including random, circumstances and factors, therefore, when analyzing the dynamics, we are talking not just about a development trend, but about the main trend, fairly stable (sustainable) throughout this stage of development. In some cases, this pattern, the general trend in the development of an object, is quite clearly displayed by the levels of the dynamic series. The main trend (trend) is a fairly smooth and stable change in the level of the phenomenon in time, more or less free from random fluctuations. The main trend can be represented either analytically - in the form of an equation (model) of the trend, or graphically. The identification of the main development trend (trend) is also called in statistics the alignment of the time series, and the methods for identifying the main trend are called alignment methods. One of the most common ways to identify the main trends (trend) of a series of dynamics are the following methods: - consolidation of intervals; - moving average (the essence of the method is to replace absolute data with arithmetic averages for certain periods). The calculation of the averages is carried out by the sliding method, i.e., the gradual exclusion from the accepted period of the first level and the inclusion of the next one; - analytical alignment. In this case, the levels of the dynamics series are expressed as functions of time: 1) f (t) = a0 + a1t - linear dependence; 2) f (t) = a0 + a1t + a2t2 - parabolic dependence. The method of enlargement of intervals and their characteristics by average levels consists in the transition from shorter to longer intervals, for example, from days to weeks or decades, from decades to months, from months to quarters or years, from annual intervals to long-term intervals. If the levels of a series of dynamics fluctuate with more or less certain periodicity (wave-like), then it is advisable to take the enlarged interval equal to the period of oscillations (the length of the "wave" of the cycle). If there is no such periodicity, then the enlargement is carried out gradually from small intervals to ever larger ones, until the general direction of the trend becomes sufficiently distinct. If the dynamics series is momentary, and also in cases where the level of the series is a relative or average value, the summation of the levels does not make sense, and the aggregated periods should be characterized by average levels. When the intervals are enlarged, the number of members of the dynamic series is greatly reduced, as a result of which the level movement within the enlarged interval falls out of the field of view. In this regard, to identify the main trend and its more detailed characteristics, the series is smoothed using a moving average. Smoothing a series of dynamics using a moving average consists in calculating the average level from a certain number of the first levels in the series, then the average level from the same number of levels, starting from the second, then starting from the third, etc. Thus , when calculating the average level, they “slide” along the time series from its beginning to the end, each time discarding one level at the beginning and adding one next. Hence the name - moving average. Each link of the moving average is the average level for the corresponding period. With a graphical representation and with some calculations, each link is conventionally referred to the central interval of the period for which the calculation was made (for an instant series, to the central date). The question of for what period the moving average links should be calculated depends on the specific features of the dynamics. As with the enlargement of the intervals, if there is a certain periodicity in the level fluctuations, then it is advisable to take the smoothing period equal to the oscillation period or a multiple of its value. So, in the presence of quarterly levels that experience annual seasonal declines and increases, it is advisable to use a four- or eight-quarter average, etc. If the level fluctuations are erratic, then it is advisable to gradually increase the smoothing interval until a clear trend pattern emerges. Analytical alignment of the time series allows you to get an analytical model of the trend. It is produced in the following way. - Based on a meaningful analysis, a stage of development is singled out and the nature of the dynamics at this stage is established. - Based on the assumption of one or another pattern of growth and from the nature of the dynamics, the form of the analytical expression of the trend is selected, the type of approximating function, which graphically corresponds to a certain line: a straight line, a parabola, an exponential curve, etc. This line (function) expresses the expected pattern of a smooth level changes over time, i.e. the main trend. In this case, each level of the dynamics series is conditionally considered as the sum of two components (components): yt=f(t)+?t. One of them (yt = f (t)), expressing the trend, characterizes the influence of permanent, main factors and is called the systematic regular component. Another component (8t) reflects the influence of random factors and circumstances and is called the random component. This component is also called residual (or simply residual), since it is equal to the deviation of the actual level from the trend. Thus, it is assumed (conditionally assumed) that the main trend (trend) is formed under the influence of constantly acting main factors, and secondary, random factors cause the level to deviate from the trend. The choice of the curve shape largely determines the results of trend extrapolation. A meaningful analysis of the essence of the development of this phenomenon can be used as the basis for choosing the type of curve. You can also rely on the results of previous studies in this area. The simplest empirical technique is a visual one: choosing a trend shape based on a graphical representation of a series - a broken line. In practice, the linear dependence is used more often than the parabolic one, due to its simplicity. SOCIO-ECONOMIC STATISTICS Topic 9. SUBJECT AND METHOD OF SOCIO-ECONOMIC STATISTICS AND INDICATORS USED IN STATE REGULATION 9.1. The concept of socio-economic statistics, its subject and method Socio-economic statistics is a scientific discipline that studies the quantitative characteristics of mass phenomena and processes in the economy and the social sphere. The data of socio-economic statistics provide a systematic quantitative description of the various economic and social processes taking place in society. This discipline includes such sections as socio-demographic statistics, population living standards statistics, labor and employment statistics, price statistics, investment statistics, national wealth statistics, statistics of various industries (transport, construction, population, agriculture, etc.). .). The following indicators are used in socio-economic statistics: - indicators of price dynamics; - indicators of the volume and cost of manufactured products; - indicators of the number and composition of the population; - indicators of the standard of living of the population; - indicators of income and expenses of the population; - indicators of labor, material and financial resources; - indicators of productivity and wages; - indicators of the availability of fixed and working capital; - macroeconomic indicators. The above indicators are calculated by various methods using the tools of the general theory of statistics. An important condition in the statistical methodology is to ensure the comparability of data in time and space and internationally. Thus, the subject of socio-economic statistics is the study of socio-economic indicators in specific conditions of place and time, the analysis of their dynamics and the most important relationships. The main tasks of socio-economic statistics are: - provision of information necessary for government authorities to make appropriate decisions in the field of the formation of socio-economic policy and government programs; - informing all interested persons and institutions about the state of the economy and social sphere of the state and population groups; - providing data on the results of the socio-economic development of the country to research institutions, socio-political organizations. The listed tasks of socio-economic statistics are in close interaction with the implementation of the program of socio-economic development of the country. In modern socio-economic statistics, great importance is attached to indicators of the economic situation, reflecting changes in the volume of production of gross domestic product (GDP) depending on the increase or decrease in the level of capacity utilization and, as a result, changes in consumer demand. Economic growth indicators indicate a change in the volume of GDP production as a result of increasing production capacity, attracting investment, and increasing labor productivity. In addition to the above, an important task of socio-economic statistics is the analysis of the state budget, the study of its structure, dynamics, sources of formation and directions of spending. In this regard, various absolute and relative indicators are used, including the ratio of the state budget deficit to GDP to assess the effectiveness of fiscal and monetary policy. Another equally important task is to study the factors affecting the savings rate. Such factors are the size of the bank interest rate, the amount of disposable income, the profitability of deposits, etc. At present, foreign economic relations are actively developing in Russia, therefore, there is an increased interest in reliable statistical data on foreign trade, in statistical monitoring of exchange rates, and in the analysis of factors affecting the dynamics of the exchange rate. The next important task of socio-economic statistics is to analyze the activities of the money and stock markets and their impact on the formation of various macroeconomic indicators. In this regard, statistical bodies are obliged, relying on an interconnected system of statistical indicators that comprehensively and fully characterize the relationship between socio-economic phenomena, to collect, process and provide for further analysis all the necessary information for policy development and management decision-making in the field of economy and social life of society. The study of the labor, material and financial resources of the country is another important task of socio-economic statistics, which is solved using the system of national accounts by compiling a balance of assets and liabilities. Observation and monitoring of the state of the environment is also the responsibility of the statistical authorities, which must monitor the depletion of natural resources and provide the necessary information on the state of natural resources and the conditions for their consumption. The system of statistical information includes information, description and analysis of such economic phenomena and processes as: - structure and development of the country's economic resources; - population, the most important indicators of reproduction; - the results of the economic process, the rate of economic growth; - distribution of income; - factors affecting inflation; - employment and unemployment and factors influencing them; - dynamics of the standard of living of the population, consumption of goods and services; income and savings; - investment process, efficiency of funding sources; activity of the financial system: financial transactions, state budget, financial debt, stock market; state of the environment. Speaking about the statistical methodology in the study of the socio-economic life of society, it should be noted that it should be based on scientifically developed concepts and definitions that reflect the studied processes, phenomena, mechanisms of the economic and social environment. The core of such a scientifically organized analysis is the methods of the general theory of statistics, as well as the balance method. 9.2. Scorecard and organization of economic statistics Applying statistical methods and tools to study a certain kind of economic phenomena and the entire economy as a whole, we obtain statistical data that are numbers or figures. They should not be considered as mathematical numbers, since the numbers, figures used in statistics are not abstract, that is, they characterize statistical data as statistical indicators. In economic statistics, economic indicators are generalizing data that reflect any economic phenomena or processes. The object of economic statistics is the economy of our country, in which all the studied processes and phenomena are not isolated, but are interconnected, therefore, all statistical indicators characterizing these phenomena and processes are also not isolated. Thus, all statistical indicators are interconnected and form a system of statistical indicators. The system of statistical indicators is a set of interrelated statistical indicators that has a single-level and multi-level structure and is aimed at solving a specific statistical problem [1] . The system of indicators of economic statistics is a base of statistical indicators of the economy, which is formed to explain many economic issues and has at its disposal a certain number of links with its own structure. Since all indicators of the system are interconnected, any unknown indicator can be calculated knowing its other constituent indicators. The system of indicators of economic statistics covers all economic aspects of society at various levels: countries, regions - the macro level; enterprises, firms, associations, families, households - the micro level. The system of indicators of economic statistics is aimed at solving the following tasks: - to show in an interconnected configuration the structure of the functioning of the economy of the Russian Federation; - to determine the primary tasks of the analysis of the processes taking place in the Russian economy; - establish a system of indicators that are necessary for analysis both at the federal and regional levels, taking into account domestic and world experience, recommendations of international economic organizations; - to argue modern approaches to the method of organizing statistical information; - develop a statistical set of methods based on the content side of the economic analysis itself. The process of studying economic phenomena and processes through a system of indicators of economic statistics is called statistical research. The system of indicators of economic statistics has the following features: - is of a historical nature: the living conditions of the population and society are changing - the statistical indicators of a certain economic system are also changing; - the set of methods for calculating statistical indicators is constantly being improved. Based on the system of indicators of economic statistics, a greater readiness to solve the problems of the economy is ensured. There is the following classification of types of statistical indicators. By coverage of individual units of the population: - individual statistical indicators characterizing a separate unit of the statistical population; - summary statistical indicators, which are divided into volumetric statistical indicators, calculated by summing up individual statistical indicators and characterizing the total volume of the attribute; - calculated statistical indicators calculated by various formulas and designed to solve all kinds of analytical issues. Time factor: - momentary statistical indicators, which are established and fixed for a certain date; - interval statistics, which are established in a certain period of time. In terms of wording: - absolute indicators characterizing the absolute values of economic phenomena and processes, reflecting their transient characteristics; - relative indicators showing the balance between the quantitative characteristics of economic processes and phenomena, calculated by dividing one absolute indicator by another; - the average statistical indicator is a generalized quantitative characteristic of a property in a statistical population, in certain circumstances, as well as in specific conditions of place and time. Consider the main socio-economic indicators of the Russian Federation for 2002 (Table 9.1), presented by the State Statistics Committee of Russia. Table 9.1 Main socio-economic indicators of the Russian Federation for 2002 
All activities for the collection, processing of primary information on the state of economic entities are assigned to the bodies of state statistics of the Russian Federation. An essential stage in the organization of economic statistics is the collection of primary data from all economic entities (enterprises, organizations, firms). At the same time, the main collection methods are accounting and statistical reporting, compiling registers, economic and population censuses, sample surveys, etc. Accounting information makes up a significant amount of all information collected. The task of economic statistics is to bring the collected accounting data in accordance with the requests of economic statistics. Statistical authorities should apply an established system for collecting primary data by forming an effective system for transmitting and storing information using modern means of communication and computer technology. Economic statistics provides a method for quantitatively characterizing the phenomena and processes under study, based on economic classifications, which involve the definition of criteria for distributing the total population into homogeneous groups. Such classifications make it possible to determine the quantitative characteristics of individual groups, as well as their specific gravity. In addition, economic classifications help organize data and create a basis for coding it. The connection between economic statistics and accounting has a two-way character: accounting information is used in the calculation of generalizing statistical indicators; the principles and requirements of economic statistics are taken into account when drawing up the chart of accounts and accounting reporting forms. Primary data obtained from various sources are eventually processed to calculate summary indicators. 9.3. Notation in statistics Organizing the statistical study of mass socio-economic phenomena, statistics forms the initial statistical concepts and categories, various systems of notation. These include systems of indicators, systems of units of measurement, systems of groupings and classifications, systems of national accounts, systems of unified documentation, etc. Statistical methodology is a set of general principles and methods of statistical research, the basis of which is the use of common notation systems. The system of indicators in statistics is understood as a list of indicators bound by semantic unity and subject to a certain logic of construction that characterize socio-economic phenomena and categories in their interrelation. Statistical indicators have a qualitative and quantitative assessment. An indispensable condition for the analyticity of a quantitative indicator is its compliance with the OKEI unified system of units of measurement, which includes a list of standards for measuring measures, weights, lengths, volumes and other characteristics inherent in the objects of study adopted in our country. A comprehensive statistical study of socio-economic processes and phenomena is most fruitful if it is based on a system of groupings. The system of groupings is a series of interrelated statistical groupings according to the most significant features, comprehensively reflecting the most important aspects of the phenomena being studied. If the grouping is based on several features, such a grouping is called complex. Depending on the type of grouping characteristics, groupings are distinguished according to quantitative and qualitative characteristics. In statistical practice, a researcher is often faced with the fact that a qualitative attribute has a large number of varieties, and it does not seem appropriate to list them all, for example, types of fixed assets, a range of goods and products, professions of workers and employees, etc. In these cases, a classification of varieties is developed , i.e., carry out a systematic distribution of objects observed by statistics into classes (groups). Classification is usually understood as a stable differentiation of units of observation, which is used for a long time. Classifications may be subject to more or less significant changes when it becomes necessary to reflect the changes that have occurred in the object of observation. Classifications are approved, as a rule, as a national or international standard. Thus, classifiers are created - encoded lists of a set of qualitative features that describe the phenomenon under study. We list the most important of them. OKATO - the all-Russian classifier of objects of administrative-territorial division - is designed to ensure the reliability, comparability and automated processing of information in the field of statistics. The objects of classification in OKATO are republics, territories, regions, cities of federal significance, autonomous regions, districts, districts, cities, etc. OKVED - the all-Russian classifier of types of economic activity - is intended for classifying and coding types of economic activity and information about them. OKVED is used in the implementation of state statistical monitoring of the development of economic processes by type of activity, in the preparation of statistical information for comparisons at the international level. OKOGU - the all-Russian classifier of public authorities and administration - is designed to streamline and systematize information about public authorities and administration, to conduct statistical accounting and provide state statistical observations. OKFS - the all-Russian classifier of forms of ownership - is intended for the formation of information resources, registers, registers and cadastres containing information about subjects of civil law, for solving analytical problems in the field of statistics. The objects of OKFS classification are forms of ownership. OKOPF - the all-Russian classifier of organizational and legal forms - is also designed to solve analytical problems in the field of statistics. The objects of the OKOPF classification are organizational and legal forms. OKSM - the all-Russian classifier of countries of the world - is designed to identify countries. The objects of classification of OKSM are sovereign states or any other territories that have political, economic, geographical or historical features. All of the above classifiers are part of the Unified Classification and Coding System for Technical, Economic and Social Information of the Russian Federation (USCC) and are developed in accordance with the regulatory framework in force in the Russian Federation and are harmonized with the Statistical Classification adopted in the European Economic Community. When developing these classifiers, a hierarchical classification method and a sequential coding method are used. In connection with the transition to the internationally accepted system of accounting and statistics in Russia, the Unified State Register (register) of enterprises, organizations, institutions and associations - USREO has been created and is functioning. The purpose of its creation is to ensure a unified state accounting of enterprises and organizations, the formation of an information fund. The most important section of the information fund - classification - contains the classification of subjects in accordance with the above all-Russian classifiers. The USREO information fund consists of three sections: identification, reference and economic. The identification section is the registration code of the object, unique for the entire information space of Russia; reference contains information about the name of the head, the address of the object, phone numbers, etc. economic contains indicators characterizing the subject. Thus, the notation systems adopted in state statistics are the official standards of the Russian Federation and are used to solve analytical problems; they are the basis for the methodology for collecting and processing statistical information both for internal needs and for comparison at the international level. 9.4. Statistical indicators used in government regulation One of the main functions of the state in modern society is the regulation of the processes of the socio-economic life of the country. The main tasks of state regulation are to increase the efficiency of the economy and the standard of living of the population. To solve the major socio-economic problems facing society, statistics offers a comprehensive system of indicators that characterize all aspects of the social and economic processes taking place in the world around us. Much work is being done in statistics and in the field of improving the system of indicators characterizing the level and dynamics of the development of the economy and the social sphere. The criterion for the efficiency of the economy is the optimal ratio of the produced national income or its incremental value to the expended resources of the labor force and production assets. The generalizing indicator of efficiency measures the achieved result of social production with actual costs or resources. For this purpose, the amount of national income produced, expressed in actual prices, is often used. National income plays the role of a source for the formation of the state budget, money circulation in the country, payments for international settlements, etc. A generalizing indicator calculated from national income makes it possible to establish real costs per unit of the newly created part of the gross social product, on the basis of which, with the help of intersectoral balance determine intersectoral proportions, coefficients of direct and indirect costs per unit of certain types of products, cost and regional structure of the gross social product, etc. The indicator of economic efficiency, calculated on the basis of costs, reflects the real level of annual costs for the production of a unit of national income. It shows how much living labor, raw materials, materials, fuel is spent on the production of national income. A detailed characteristic of the efficiency of the use of human labor is shown by the combination of the following indicators: - productivity of social labor; - the complexity of products and works; - the ratio of growth rates of productivity and wages; - use of working time funds. There are a large number of indicators characterizing technical progress, the use of fixed and working capital. Cost-effectiveness indicators of production assets include the material intensity of the total social product. Indicators of the efficiency of the use of resources of production assets include the produced national income per unit of fixed assets, profit per unit of fixed assets and the velocity of circulation of working capital. The effectiveness of technical progress is characterized by the increase in the produced national income per unit of increase in the totality of production assets, the payback period of capital expenditures for the introduction of new technology. Of great importance in state regulation is the analysis of the state of the securities market. Securities market indicators are calculated by their types, such as stocks, bonds, etc. Securities market indices determine the dynamics of stock prices, they can be calculated daily, weekly, monthly, quarterly, semi-annually, annually. Securities market indices allow you to compare price changes in different market segments and draw a conclusion about which sector of them is the most profitable for investors at the moment. In the conditions of the modern economy, the analysis of the dynamics of prices for goods and services is of great practical importance. Indicators characterizing inflationary processes in the consumer goods market are used in solving many economic problems. To assess the dynamics of prices for goods, the consumer price index is used. It helps in assessing inflation, indexing income, determining current production costs. The methodology for calculating the index is the same for many countries, which allows for international comparisons. Also, for state regulation of processes in the economy, the deflator index is used, which assesses the degree of inflation for the entire set of goods produced and consumed in the state, while taking into account investments, exports and imports of goods and services. Various aspects of the country's industrial and social life are characterized by statistical indicators of the standard of living of the population. The task of state regulation of the standard of living of the population is to study the patterns and trends in this level. The main sections of the system of indicators of the standard of living include indicators of income of the population, indicators of expenditure and consumption of the population, indicators of the service sector, working and rest conditions, and demographic indicators. Income! The population is characterized by monetary wages, deposits of the population, real incomes of the population, their structure and dynamics. Studying the indicators of expenditures and consumption of the population, they consider the family budget, the consumption of food and non-food goods and services, their structure and dynamics. Indicators of the service sector include trade turnover, provision with housing, consumer and communal services, indicators of health care, education, culture, etc. Working and rest conditions characterize the employment of the population, the length of the working day, weeks, holidays. Demographic indicators include birth rate, death rate, average life expectancy, etc. The most important tasks of state regulation are to ensure the correct balance and avoid disproportions between various sectors of the economy, the development of long-term plans for the development of the economy and the social sphere. It is statistics that ensures the fulfillment of these tasks in terms of providing deep and versatile information about the current state of socio-economic relations in society, about trends, shortcomings and disproportions in the development of individual elements and sectors of the economy and the social sphere. Topic 10. NATIONAL ACCOUNTING AND THE SYSTEM OF NATIONAL ACCOUNTS 10.1. Statistical methodology of national accounting The object of national accounting is the country's economy. The subject of national accounting is a statistical description of the state and development of the country's economy using a system of macroeconomic indicators and national accounts formed from them, intersectoral balance tables and other tables. The word "accounting" in this context reflects the connection of the system of macroeconomic indicators with accounting. This explains the use of the basic principles of accounting in national accounting: the value expression of all indicators, the balance method, the double entry method, the assumption of an unlimited duration of the functioning of the economy. National accounting focuses on the market economy, its mechanisms and institutions. The theoretical basis of national accounting is the recognition of the equality of all forms of ownership, the market nature of price formation based on competition, the natural desire of all people to profit. National accounting is based on a market economy, actively regulated by the state. The state in the system of national accounts is represented by an independent sector that provides non-market (free) services to the population and distributes and redistributes income according to the principles of both economic and social justice. The System of National Accounts (SNA), focusing on the welfare state, makes the social policy of the state "open", showing the cash flows of the redistribution of income, i.e., national accounting is oriented towards an open economy included in broad international economic relations. Such an economy is characterized by freedom of movement across the country’s borders not only for goods and services, but also for factors of production: labor, capital, entrepreneurship, investment, new technologies, etc. National accounting is a practically working system created on the basis of and in accordance with the international standard of the SNA, adapted to the national conditions of transition to a market economy. The System of National Accounts (SNA) is an accounting corresponding to the national market economy, which at the macro level is represented by a system of interrelated statistical indicators, built in the form of a specific set of accounts and balance sheets that characterize the results of economic activity, the structure of the economy and the most important interconnections of its links. The national accounting system uses two types of classification units: activity and institutional unit, which are grouped by industries and institutional sectors. Main institutional sectors: - households whose sources of financing of expenses are wages, income from property, income from production activities, transfers from the state, etc.; - non-profit organizations serving households. These include trade unions, religious organizations, parties and social and political movements, public organizations funded by membership dues and voluntary donations. They provide services that meet the special needs of households; - state institutions, including state authorities and local self-government, state off-budget funds. Enterprises financed from the budget, produced products or services are transferred to consumers free of charge or at economically insignificant prices; - financial institutions include the Central Bank, commercial banks, non-state insurance funds, investment companies, etc. Produce financial services, mainly financial intermediation, the source of financing of which is the proceeds from the services rendered, sold on the competitive market; - non-financial enterprises - institutional units that produce products and non-financial services sold on the market at economically significant prices and cover their costs from the profits received. The term "rest of the world" is used to describe international relations. Types of economic activity are determined by the OKVED classifier by entering an enterprise, institution in the USREO. National Accounting studies the economy as a system of assets and liabilities. An economic asset is characterized by the following features: - the subject of the economy has the right of ownership to the asset; - the realization of this property right allows the subject of the economy to receive or hope to receive income or other economic benefits; - the asset has a valuation, i.e. monetary measurement. Assets are divided into financial and non-financial. Financial assets do not have a material substrate that determines their value. A financial asset of one entity is opposed to a financial liability of another entity. Financial assets include cash and deposits, loans, securities (bills, bonds), shares, insurance policies. Non-financial assets1 are divided into two groups: tangible and intangible; produced and unproduced. All of the above concepts of national accounting are described by indicators and the national accounts formed by them. Indicators and national accounts form a system where they are interconnected and complement each other, and in general accurately and comprehensively describe the country's economy. The main accounts of the system of national accounts are: - income generation account (Table 10.1); Table 10.1 Income generation account 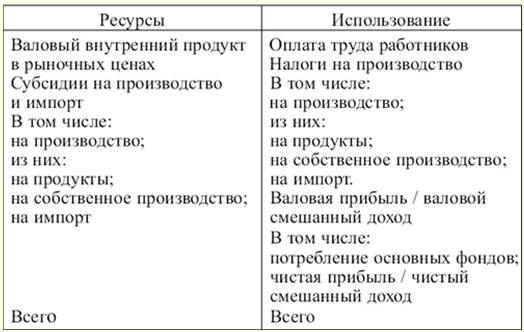
- income distribution account (Table 10.2); Table 10.2 Income distribution account 
- account for the use of income (Table 10.3); Table 10.3 Income use account 
- capital cost account (Table 10.4). Table 10.4 Capital cost account 
The sequence of formation of national accounts indicators corresponds to the sequence of stages of the reproduction cycle. 10.2. Statistics of socio-economic indicators at the macro level There are many social and economic indicators that characterize the life of the country at the macro level. These include gross domestic product, total or per capita, gross national income, economic growth rates, national wealth, public debt, the US dollar against the ruble (which is set by the Central Bank of the Russian Federation), the number of registered unemployed, etc. Of all the above socio-economic indicators, the most important is the indicator of the gross domestic product of the state, which can be calculated in several ways (depending on the stage of production): - production method (at the stage of value-added production) - determines the value of GDP as the difference between the total volume of output and intermediate consumption, or it is the sum of the gross value added of all industries and sectors of the economy. This is how the GDP produced is calculated; - distributive method (produced at the stage of distribution of manufactured products) - as the sum of incomes of production factors, which is obtained as a result of summing incomes from labor (wages and accruals on it, fees, income in kind, commissions, etc.), income from property (profit , rent, dividends, etc.), mixed incomes (income of freelancers, income from farming, self-employment, etc.). This method calculates the distributed GDP; - method of end use (in terms of costs) - as a result of summing up the costs of all economic agents using it (firms, households, foreign citizens, states), i.e. GDP = P + I + W + E, where P - personal consumer spending of households on durable goods; I - gross investments (enterprise investments in the purchase of new equipment and construction, excluding housing); Z - government purchases of goods and services (expenditures for education, health care, the army, etc.); E - net exports (the difference between exports and imports of the state). GDP can be calculated at both factor and market prices. Factor prices are determined by the cost of all factors of production for the creation of goods and services, i.e., this is the price of the producer, which consists of the cost of production and profit. Market prices are the sum of factor prices and indirect taxes (value added tax (VAT), excises, customs duties, etc.) minus subsidies, which include gratuitous receipts from the state and other sources for products, imports, compensation for damages, etc. In Russia, GDP and gross national product (GNP) are currently calculated by the production method, i.e. GDP is the sum of the gross value added of industries and sectors of the economy, net taxes on products (excluding subsidies). The next most important indicator is the country's national income, which is obtained by subtracting depreciation from the gross national product. At the same time, net national income (NNI) is calculated as the sum of national income and net transfers from abroad (humanitarian aid, gifts, donations, etc.) minus net transfers abroad. Gross national product (GNP) shows the value of the final product produced by factors of production owned by citizens of a given state, even if they live in other countries. GNP = GDP + NFD, where NFD is the net factor income from abroad, i.e. the difference between the income received by citizens of a given country abroad and the income of foreigners received in the territory of this country. In order to analyze the socio-economic situation in the country, it is necessary to group the following indicators:
You can also group according to other criteria if necessary. The dynamics of indicators of the results of economic activity is studied by calculating the corresponding indices of physical volume according to the formula 
where q0P0 is the actual value of gross output, gross domestic product, national income in the base period; q1P0 - the cost of the same indicators of the reporting period in the prices of the base period. In a market economy there is a constant rise in prices for goods and services. The main problem that arises in the calculation of indices is the revaluation of the cost indicators of the reporting period in the prices of the base period. Since inflation is an uneven process, it is practically impossible to recalculate the prices of each type of goods and services into comparable prices with the base period. In the theory of statistics, there are three main methods for converting indicators of gross domestic product and national income into comparable prices with a base period: using a direct assessment of the volume of production of goods and services at the prices of the base period; through the revaluation of any components of the gross domestic product and national income using the relevant indices; based on the consumer price index. The first method is very difficult to calculate. It was most often used in the planned system of management. Its essence lies in the fact that the physical volume of output (in physical terms) is multiplied by the corresponding prices of the base period. The method allows you to take into account in detail the dynamics of changes in prices for goods and services, but its disadvantage is that it becomes necessary to regularly change the base prices, and there is also a problem of comparability of goods and services of the same name due to changes in their quality (for different years of production), which forces to look for a set of representative products that will determine the composite price index, and this is also very inconvenient and problematic. The second method is not as accurate and complex as the first, and consists in the fact that the elements of gross domestic product and national income are converted into comparable prices by dividing by the appropriate index, i.e. when revaluing construction products, the capital investment index is used, when revaluing machinery and equipment - the price index for machinery and equipment, etc. This method of recalculation requires a fairly wide base for calculating the corresponding price indices. The third of the listed methods, built on the basis of the consumer price index, is the simplest, not entirely accurate, but convenient for calculating comparable prices and is used in most developed countries. However, this method does not take into account the dynamics of changes in prices for public services and capital investments, for export-import operations, for capital goods in other sectors of the economy. 10.3. national wealth statistics An important section in economic statistics is the section devoted to the statistics of national wealth. National wealth is a set of accumulated tangible and intangible assets created by the labor of all previous generations, belonging to the country or its residents and located in the economic territory of this country and outside it (national property), as well as explored and involved in the economic circulation of natural and other resources [2]. National wealth statistics helps to collect and analyze data of all its components in general and in each category separately, on the basis of which it is possible to determine the main flows of national wealth, the investment activity of individual sectors of the economy, the degree of liquidity of their financial assets, and much more. The obtained statistical data on national wealth give an economic assessment of the country as a whole, its property status, as well as how the country's economic potential meets international standards. When considering and analyzing statistical data, it is possible to determine the potential, acceptable opportunities for the further development of the country. Components of national wealth: natural resources (land, minerals, energy resources, forests and wildlife), which are accounted for and involved in the turnover. As a characteristic feature of natural resources, it can be distinguished that they are non-reproducible benefits. When obtaining statistical data on natural resources, you can: - develop a system of indicators on the efficient use of natural resources; - analyze the work of environmental protection measures, evaluate the effectiveness of their work; - determine the amount of financial resources that will be needed for environmental purposes; - to analyze the extent to which the human factor has an impact on the natural environment, as well as how the environment affects the quality of the standard of living of the population: - material resources acquired as a result of accumulated labor. Material resources can be produced at any time, hence they are reproducible goods; national property - is formed in the process of production, it includes: - fixed assets (buildings, structures, vehicles, machines, equipment, etc.). Statistical data of fixed assets characterize their general condition, prospects for the development of fixed assets throughout the country and separately in each industry; - working capital (production stocks - raw materials, materials, fuel, spare parts; work in progress; finished products, material reserves, etc.); - personal property. National wealth statistics are used to assess the level of economic development; - accumulated scientific and technical potential; - intellectual potential. So, the national wealth includes the value of all production and non-production assets of the state, stocks, reserves, individual and public property. In some cases, national wealth includes the scientific and technical level and experience of workers. National wealth consists of accumulated products of past labor, including consumer goods, and natural resources accounted for and involved in economic turnover. As part of the national wealth, stocks and reserves are accounted for separately according to the place of their determination and the duration of storage. The gold reserves of the country and reserves for the needs of the state's defense are also taken into account separately. Calculations on national wealth are carried out in current and comparable prices that exist at the moment. Statistical indicators of national wealth show the level of development of the country on an international scale. 10.4. Building balances for regions as a whole The construction of balance sheets and the typology of Russian regions, the analysis of their differentiation in terms of various indicators of socio-economic development have become one of the key areas of research in the rapidly developing Russian regional economy. The same term - "region" - describes socio-economic systems that are completely incomparable in terms of scale of activity, direction of development, political orientation, therefore, the construction of a typology serves as a starting point, a condition for analyzing regional economic systems and building balances for regions as a whole. When studying the differentiation of Russian regions, it is necessary, first of all, to select the factors that determine the specifics of the socio-economic situation of the region. It should be emphasized that local governments at the regional level began to work on the development of plans and programs for economic development at the regional level only in the post-Soviet period. In fact, they had no traditions, skills or experience in this area. Under the conditions of the Soviet centralized economic and political system, local governments were part of the structure of the centralized political and economic system. In the system of centralized planning of the economy, local governments were completely dependent on central ministries, enterprises subordinate to the center, and party structures. The responsibility of the local government included the provision of socio-economic infrastructure in accordance with centrally established standards, the task of building a regional balance was secondary. The very formulation of the problem of analyzing the economic situation of the regions became relevant only in the conditions of post-Soviet development, when local governments got the opportunity to actively influence the processes of economic development at the regional level. In general, the development of regional balances serves as a condition for effective adaptation to local conditions of the social policy developed at the federal level (pension policy, employment program, housing program, federal standards in the field of healthcare, education, social protection of the population). The selection of indicators for building a balance of the socio-economic situation in the regions, focused on the choice of methods for implementing social policy, is a rather difficult task. The use of such an indicator as the gross regional product implies the improvement of the methodology for its calculations and the development of a system for accounting for the economic activity of regions in the system of indicators of national accounts. When using this indicator at the regional level, it is necessary to study the theoretical and methodological aspects of the relationship (GRP), output per capita, and the level of well-being. For most federal governments, having a system of regional economic accounts compatible with the System of National Accounts (SNA) is vital. As a rule, the economic accounts of the regions are included in the SNA as an integral part. To date, the SNA is the only reasonable, generally recognized tool for macroeconomic analysis of the real economy, including the regional one. The central indicator of regional accounts is the gross domestic product produced in the region. In Russia, this indicator (gross regional product - GRP) is calculated only at the level of subjects of the Russian Federation. The methodological basis for the calculations is under development. Official recommendations on the development of a system of regional economic accounts, as well as on the composition of such accounts, have not been published. It is obvious that the study of regional differences in the economic development of Russia cannot be carried out on the basis of only one resulting indicator - GRP. Actual differences can be estimated as a result of building regional balances and analyzing the economic process by region, which can be described San system of economic accounts of the region. When developing the economic accounts of the regions, a system of key indicators is selected that reflect the general macroeconomic situation in the region, the state of the real sector, the budgetary and financial system. We can propose the following system of indicators for building a regional balance. Macro-indicators and the real sector: GRP / per capita (thousand rubles); volume of industrial output / per capita (thousand rubles); agricultural production / per capita (thousand rubles); share of the urban population in the total population (in %); investment in fixed capital / per capita (thousand rubles); foreign investment / per capita (USD); export volume / per capita (thousand rubles); retail trade turnover / per capita (thousand rubles); consumer price index (in %; December / December of the corresponding year); cash income / per capita (thousand rubles); purchasing power of money income (in %); the level of general unemployment (in %); poverty rate (in %). Financial and budgetary systems: budget deficit referred to GRP (in %); share of tax revenues in budget revenues (in %); the share of profit on the main types of economic activity, referred to the GRP (in %); share of unprofitable enterprises (in %); share of overdue accounts payable, referred to GRP (in %); the number of operating credit institutions per 10 enterprises; share of credit investments related to GRP (in %); the share of overdue debt on loans in the total volume of loans (in percent); share of current and settlement accounts of enterprises, referred to GRP (in %); household deposits referred to GRP (in %); purchase of currency / per capita (thousand rubles); currency sales / per capita (thousand rubles). The proposed system of indicators is an agreed scheme for collecting, describing and linking the main flows of statistical information, which are expressed in macroeconomic indicators that characterize the most important results and proportions of the economic development of regions. With their help, the regional balance can be represented in the form of a series of tables that show the resources and use of material incomes and benefits of the regions. Auxiliary tables allow you to refine individual aggregated indicators according to a particular criterion. They are used for the purposes of inter-budget equalization, development of standards for budget financing, which are part of the key parameters of the draft federal budget. Topic 11. STATISTICS OF POPULATION, LABOR AND LIVING STANDARDS 11.1. Population, employment and unemployment statistics The economically active population (labor force) is the part of the population that provides the supply of labor force necessary for the production of goods and services. The economically active population is divided into employed and unemployed and varies in relation to the surveyed object. The share of the economically active population in the total population is the level of economic activity of the population. Employed persons include female and male persons over the age of 18, as well as persons under the age of sixteen, who during the period under review: - performed work for hire for remuneration on a full or part-time basis, as well as other income-generating work independently or for individual citizens, regardless of the timing of receiving direct payment or income for their position. The registered unemployed who perform paid public works received through the employment service, as well as pupils and students who perform paid agricultural work in the direction of educational institutions are not included in the composition of the employed; - temporarily absent from work due to illness or injury; patient care; annual leave or days off; compensatory leave or time off; compensation for overtime work or work on public holidays (weekends); work according to a special schedule; being in reserve (when working in transport); statutory leave for pregnancy, childbirth and childcare; training, retraining outside the workplace; study leave; leave without pay or with pay at the initiative of the administration; strikes, other similar reasons; - Performed unpaid work in a family business. The unemployed include persons over 16 years of age who, during the period under review: - did not have a job (profitable occupation); - searched for work, i.e. applied to state or commercial employment services, used or placed advertisements in the press, directly applied to the administration of the enterprise (employers), used personal connections or took steps to organize their own business; were ready to get to work. When referring to the unemployed, all three criteria must be met simultaneously. The unemployed also include persons studying in the direction of the employment service. Pupils, students, pensioners and persons with disabilities are counted as unemployed if they were looking for work and were ready to start it, in accordance with the listed criteria. The unemployed include persons who are not employed, registered with the employment service as job seekers or recognized as unemployed. The proportion of the unemployed in the economically active population is the unemployment rate. The duration of unemployment is the period of time during which a person is looking for a job (from the moment the job search begins until the moment of employment), using any means. Information about the unemployed can be characterized by both absolute and relative indicators. The absolute number of unemployed is a momentary indicator at the beginning of each month. During the month, there are dynamics: how many unemployed are deregistered, employed, issued for early retirement, sent for vocational training, employed after completing vocational training. The composition of the unemployed can be characterized by the level of education, gender, place of residence. Relative indicators include the percentage of unemployed in the total number of unemployed able-bodied citizens registered with the employment service, and the percentage of those receiving unemployment benefits. The average number of unemployed and employed is calculated for the month, quarter, year. The unemployment rate is calculated using the following formula: 
This coefficient reflects the degree of dissatisfaction with the demand for paid labor or the excess supply of labor over demand. In addition to the general (standard) unemployment rate, other indicators are used that characterize its various aspects, such as the proportion of unemployed among young people, women who are unemployed for a long time, etc. The standard rate is usually calculated for a certain period, in which case the average monthly ( annual) indicators of the number of unemployed and employed. Also, the standard coefficient can be determined on a specific date. For this, absolute data on the number of unemployed and employed on that date are taken. There are more detailed and sophisticated methods for calculating unemployment rates, which make it possible to establish a real excess of labor supply over demand. These include, in particular, the unemployment rate in terms of the equivalent of full-time work. To quantify employment, statistics uses special indicators, absolute and relative. Absolute indicators reflect the economic potential, the possibilities of the country's economic development, since the employed population is the main element of the production process. The absolute indicators include the number of people employed in the national economy; distribution of those employed in the national economy; race- distribution of employees by spheres and sectors of the economy, gender, age, level of education; the number of people of working age employed in various sectors of the economy, etc. Relative indicators characterize the degree of involvement in the economic activity of the population as a whole and its individual age groups. These are indicators such as the employment rate of the population, the employment rate of labor resources, the employment rate of the population of working age, the employment rate of the working-age population of working age. The employment rate of the population is determined by the formula Kzn = (Szn / S) 1000, where Szn - the number of employed people; S is the total population. The coefficient of additional payment of labor resources is determined by the formula 
where TR is the number of labor resources. This coefficient can be considered more narrowly - in relation only to the concept of working age: Kzntv \u1000d (Szn / Stv) XNUMX, where Stv is the working-age population. Due to the fact that not all of the working-age population is able-bodied for health reasons, it is very important to determine to what extent the working-age population is involved in the economy. To this end, the employment rate of the able-bodied population should be calculated as the ratio of the employed able-bodied population to its total number. The closer this coefficient is to 1, the more the able-bodied population is involved in labor activity. If it is subtracted from 1, then we get the proportion of the working-age population that is not employed in any of the sectors of the economy. It is advisable to measure the degree of involvement in labor activity of the population of retirement age. To do this, you need to divide the number of working persons of retirement age by their total number. This ratio shows what proportion of persons of retirement age are employed in labor activity. 11.2. labor productivity statistics Labor productivity - the volume of production per worker. To measure labor productivity, two main indicators are used: production and labor intensity. Labor intensity - the cost of working time for the production of a unit of output. Output is the amount of output produced per unit of time by one average worker. There are the following methods for determining output: - natural (production volume is measured in natural units); - cost; - labor, or the method of normalizing working time. In statistics, there are two areas of study of labor productivity. The first direction determines the productivity of brisk labor only, i.e., it takes into account only the direct labor expended by the worker on the production of a certain quantity of output. The second direction determines the productivity of labor on a national scale, called the productivity of social labor. The use of statistics in the study, determination of labor productivity allows you to solve the following problems: - finding the main indicators characterizing the degree and dynamics of labor productivity; - study of the impact of changes in labor productivity on changes in the volume of products (works, services) and the cost of working time; - analysis of the impact of various circumstances on the degree and dynamics of labor productivity. Labor productivity statistics make it possible to identify: which industry is the most developed in the country, and which is less developed; what branch of production requires assistance from the state; how to allocate financial resources intended for use in order to develop production in the country. When analyzing the statistical data of labor productivity, it is possible to determine the main indicators of production efficiency: general indicators: - production of net products, per unit of resource costs; - profit per unit of total costs; - costs per ruble of marketable products; - profitability of production; - the share of growth due to the intensification of production; - the national economic effect of the use of units of production; labor efficiency indicators: - growth rates of labor productivity; - the share of production growth due to an increase in labor productivity; - absolute and relative release of workers; - coefficient of use of the useful fund of working time (depends both on labor productivity and on the organization of production); - the labor intensity of a unit of production - an indicator that is inverse to the development; - the wage intensity of a unit of production; performance indicators for the use of production assets: - return on assets; - return on assets of the active part of funds; - profitability of fixed assets; - capital intensity of production; - coefficient of use of the most important types of raw materials and equipment; indicators of the effectiveness of the use of financial resources: - turnover of working capital; - profitability of working capital; - relative release of working capital; - specific capital investments per unit of capacity or per unit of output; - profitability of capital investments; - payback period of capital investments; etc. Labor productivity is an indicator of the effectiveness of the use of labor resources. The indicator of labor is its productivity. Increasing labor productivity is of great economic and social importance, and it needs to be calculated at the micro level and macro level (on a national scale). From this point of view, increasing labor productivity means: - growth of the national product, income; - growth of capital accumulation and capital consumption (for expanded reproduction); - raising the standard of living of the country and solving social problems; - development of the country, economic growth, strengthening the power of the state. The growth of labor productivity within the enterprise (micro level) allows: - reduce the cost of production and sales of products (if the growth of labor productivity exceeds wages); - increase profits (increase wages for employees of the enterprise); - to carry out technical re-equipment; - increase competitiveness and ensure financial stability. When studying statistical data, it is possible to identify the main factors of production efficiency: - the main sources of efficiency increase: reduction of labor intensity, material intensity, capital intensity of production; rational use of natural resources, saving time and improving product quality; - the main directions of development and improvement of production: the acceleration of scientific and technological progress, the increase in the technical and economic level of production, improvement of the structure of production, introduction of new organizational schemes, improvement of management methods; - the level of implementation in the production management system. Depending on the nature of the influence, internal and external factors are distinguished. Internal factors include the development of new types of products, mechanization, automation of production, the introduction of advanced technologies. External factors reflect the improvement of the sectoral structure of production, state, economic and social policy, the formation of market relations, the development of market infrastructure. 11.3. Statistics on the level and quality of life of the population The standard of living of the population is a socio-economic category. Although there is no single definition for this concept in the economic literature, it can still be defined as the provision of the inhabitants of the country with material goods necessary for life. Since there is no single generalizing indicator characterizing the standard of living of the population, a number of statistical indicators are calculated for its analysis, reflecting various aspects of this category and grouped into the following main blocks[3]: - indicators of income of the population; - indicators of expenses and consumption of material goods and services by the population; - savings; - indicators of accumulated property and provision of the population with housing; - indicators of differentiation of incomes of the population, the level and limits of poverty; - socio-demographic characteristics; - a generalized assessment of the standard of living of the population. For statistical analysis and assessment of the standard of living of the population, various indicators are used, such as the volume of gross and domestic product, national income and real income per capita, housing, the value of trade, etc. There are also insignificant, but still affecting the standard of living population indicators such as birth and death rates, average life expectancy of the country's population, etc. The quality of life of the population directly depends on its level. With the growth of the standard of living of the population, the income of the population will grow, therefore, the provision of the population with material goods will increase, and the quality of life will also grow. The "quality of life" in a broad sense refers to the satisfaction of the population with their lives in terms of various needs and interests. This concept covers the characteristics and indicators of the standard of living as an economic category, working and leisure conditions, housing conditions, social security and guarantees, law enforcement and respect for individual rights, natural and climatic conditions, environmental conservation indicators, the availability of free time and the ability to make good use of it. , finally, subjective feelings of peace, comfort and stability[4] . Nowadays, even without statistical data, it is clear that the transition of the entire economy of our country to market forms of management is carried out mainly at the expense of the social sphere, which is clearly manifested in the deterioration of the demographic situation and the decline in the level and quality of life of the majority of the population. More and more people are losing their health, the main indicator of the country, such as the birth rate, is declining, life expectancy is rapidly declining, but most importantly, the population of Russia is aging, and with it the labor force. The level and quality of life of the population directly depends on the ability of people to satisfy their needs, and as you know, to meet constant primary needs, a person needs a certain constant income. The main income of the population of the Russian Federation is wages. Salary is a component of the employee's income received by him in the course of his labor activity. In addition to wages, the level of income and quality of life of the population depends on social security, the availability of material, spiritual goods and services, as well as the level of education of the main masses of the country's population, etc. The use of statistics in the study of the level and quality of life of the population allows us to solve many problems, the main of which is to obtain statistical data on the level and quality of life of the population in order to improve them. The tasks of the statistics of the standard of living of the population are as follows: - development of a system of indicators that objectively, reliably and comprehensively characterize the level and quality of life of the population; - statistical analysis of the dynamics of the level and quality of life of the population; - identification of circumstances that affect the change in the level and quality of life of the population; - determination of the main trends and patterns of change in the level and quality of life of the population; - analysis of the disparity of indicators of the level and quality of life of the population by region; - determination of the level of satisfaction of the needs of the country's inhabitants in material resources and services in comparison with the established norms of consumption; - improvement of the system of sources for collecting statistical information on the level and quality of life of the population; - determination of indicators of the level and quality of life of the population, which will be interconnected. To solve the latter problem in 1992, the Center for Economic Conjuncture and Forecasting proposed a system of basic indicators of the standard of living of the population [5]: - general indicators; - income of the population; - consumption and expenditures of the population; - monetary savings of the population; - accumulated property and housing; - social differentiation of the population; - low-income segments of the population. 11.4. Statistics of income and consumption of goods and services by the population As you know, the amount of income of the population depends entirely on the consumption of goods and services, and vice versa. An important task of social statistics is to determine the structure of consumption of the population on the basis of materials from systematic sample studies of household budgets. Usually this structure is determined by the structure of consumer spending of the population. As part of these costs, the following areas of costs are distinguished: food, sometimes with the possible separation of alcoholic beverages, non-food products and payment for services. Income and consumption of goods and services by the population is one of the main characteristics in the analysis of the standard of living of the population. As an indicator, the standard of living is calculated as monetary income per person or family. If income increases, then the consumption of goods and services increases, therefore, the quality of consumed goods and services increases. Statistics studies the amount and composition of income, its structure, dynamics in general for the entire population, as well as in the context of the country's territories, sectors of the economy, types of households, and social groups of the population. If the consumption of goods and services decreases, then you need to pay attention to income. A decrease in income leads to a decrease in the purchasing power of the population, and consequently, to a decrease in spending. Expenses made for the purchase of goods and services are called consumer spending of the population. Statistics studies the level, degree, dynamics and structure of consumer spending. Statistics on income and expenditure of the population provides an information base for analyzing the general state of the economy and living standards, for developing social and tax policies, and for assessing the possibility of expanding the investment process by mobilizing internal reserves. In order for the statistics to be most accurate, it is necessary to know the income structure when calculating. The income structure of the population is built as follows: factor income: - salary; - income from entrepreneurial activity; - income from property; transfer payments - all social pensions, benefits received not for work. If you add up the gross income of the population and transfer payments, you get the gross income of the population. From these types of income, the population pays taxes and other payments. Having statistical data on the income of the population and on the mandatory payments that the population must pay to the state, it is possible to calculate the disposable income of the population. Indicators of gross and disposable income are used to compare income in different countries, as well as to compare income by region, sectoral income of the population, territory. To define these concepts, there is an indicator of the subsistence minimum, or the minimum consumer budget - a set of consumer goods and services necessary to meet the basic socio-cultural and physiological needs of the population, as well as the costs of its acquisition. This indicator is also calculated to determine the minimum wage. The physiological subsistence minimum is the minimum limit necessary to maintain a physiological state for some time (this minimum must be provided by the state). In order to regulate the income and expenses of the entire population as a whole, the state determines the subsistence minimum for each person - the consumer basket. This concept includes the valuation of everything that a person needs for existence: a natural set of food products that takes into account dietary restrictions and provides the minimum required number of calories, as well as the cost of non-food products and services, taxes and mandatory payments, based on the share of costs for these targets in the budgets of low-income households. If the population does not have enough of their income to meet the minimum needs, this means that the country lives below the poverty line. The poverty line, i.e. poverty, is a state when income is not enough to provide a physiological minimum. The analysis of the poverty level is carried out by socio-economic and demographic groups of households and in the territorial context, "poverty zones" are identified, which include territories where the poverty level is above the national average (or above the established limit). An important part of statistics on the standard of living of the population is statistics on the consumption of goods and services. The consumption fund of material goods is a part of the consumption fund of the national income, which includes the individual consumption of the population in families and its consumption in institutions and organizations in the field of education, culture, healthcare, housing and communal services, etc. When characterizing the public consumption fund, it is necessary to determine not only the cost volume, but also the natural-material composition, taking into account the sectoral origin of the consumed material goods and sources of compensation (individual budget and public consumption funds). This grouping allows you to determine the natural-material structure of consumption in statics and dynamics. Data on the consumption of the entire population are obtained from trade statistics, financial statistics and a number of other sources. Information about the consumption of the population by main social groups and professions is contained in the statistics of the population's budgets. The main share of the consumption fund is made up of material goods acquired by the population in trade, therefore, when characterizing the people's well-being, indicators of retail trade turnover, its dynamics and structure are widely used. The totality of material goods consumed by the population is subdivided into items of short-term use - mainly food and durable items. Along with the consumption of material goods, the consumption of such services as: - teaching and educational activities of teachers, educators; - cultural, educational and aesthetic activities of artists, lecturers; - medical assistance and preventive measures of health workers, etc. Among the indicators of the well-being of the population, an important place is occupied by indicators of the provision of housing for the population and the degree of its well-being, i.e., the availability of centralized heating, water supply, gas supply, electric lighting, etc. The dynamics of consumption of specific products and services is calculated using the individual index formula: 
where I is the individual consumption index for the entire population; i - individual consumption index per capita; Q1,Q0 - the physical volume of consumption of a particular type of product or service in the current and base periods; H1, H0 - the average annual population in the current and base periods. Topic 12. STATISTICS OF ENTERPRISES OF DIFFERENT FORMS OF OWNERSHIP 12.1. business activity statistics In a market economy, statistics provides state bodies at all levels with information and analytical materials, on the basis of which decisions are made in the field of market functioning, tax and price policies are developed, and measures are taken to stimulate the development of market relations. The object of the study are enterprises in various forms of their existence. Business activity statistics uses a scorecard that includes the following main blocks: indicators of the state and balance of the market (as an external factor affecting the development of the enterprise): - product offer; - consumer demand; - capacity, saturation of the market; - market structure indicators; indicators of commodity circulation and the sale of services: - indicators of turnover and sale of services; - indicators of the structure of trade; - indicators of per capita turnover; - indicators of commodity stocks and commodity turnover; indicators of prices (tariffs) for goods and services: - price level indicators; - price structure indicators; - indicators of the purchasing power of the ruble and the monetary income of the population; indicators of infrastructure (material and technical base): - fixed assets, number, composition, capacity, size, technical equipment of enterprises; - the numerical composition of labor resources at the enterprise; indicators of socio-economic effect and efficiency of commercial activities of enterprises: - indicators of income, profit, profitability of enterprises; - distribution and production costs; - labor costs and their payment; - meeting customer demand; - taxation. The sources of information, as a rule, are the data of statistical reporting, accounting, selective and monographic studies. Statistics classifies information according to the following criteria: - on the participant of accounting work (information of accounting for goods of fixed assets, cash, containers); - management phase (planned, accounting, analytical, prognostic); - attitude to the management process (informing, managing); - relation to control objects (external and internal, incoming and outgoing); - stages of education (primary and secondary); - stability (conditionally constant standard and conditionally variable standard); - completeness of data coverage (sufficient, insufficient, redundant); - degree of completion of processing (intermediate, output or result). Methods of enterprise statistics are represented by a set of techniques and methods developed by mathematical statistics, the general theory of statistics and a number of industry statistics. Among them, we can distinguish observation statistics, summary and grouping, relative values, average values, variation indicators, indicators of time series, indices, etc. The tasks of enterprise statistics include: collection and processing of information on the state and development of the enterprise; characteristics of market relations between enterprises; study of the volume and structure, level and dynamics of various indicators of the enterprise; study of the state and development of the infrastructure of the enterprise and analysis of the socio-economic efficiency of the functioning of enterprises. The tasks set are solved by the statistical authorities together with the economic services of enterprises. Another component of business activity statistics is the statistics of trade and commercial activities of enterprises. This includes the classification of acts of sale on the basis of seller, buyer, producers and consumers, as well as on the basis of producers and resellers. Statistics considers the following main categories: turnover is a multifunctional indicator that characterizes the process of exchanging goods for money, and thus the volume of the market. The defining features are the availability of goods and the implementation of the act of sale. Statistics distinguish between wholesale, retail, gross and net turnover. Gross turnover characterizes the sum of all sales or the sum of all purchases for the reporting period. Wholesale turnover takes into account the participation of resellers in the sale of goods. Retail turnover characterizes the final sale of goods to consumers. Net turnover characterizes the sale of goods in the country as a whole and is equal to retail turnover, taking into account the turnover of catering enterprises. For individual organizations, net turnover is equal to the sum of retail turnover and the volume of output outside the organization under study. The next indicator of business activity is the product offer - this is the result of industrial entrepreneurship in the form of a commodity mass. The components of the product offer are the current production and inventory of sellers. The real level of commodity supply depends on the price level and its compliance with economic and other conditions of production. Market conditions are also reflected by consumer demand. When studying demand, a distinction is made between personal and production demand, demand for consumer goods, and for means of production. In addition, statistics differentiate demand according to a number of criteria: - macrodemand for commodity groups; - microdemand for individual goods; - dissatisfied; - Satisfied (realized); - intensive (growing); - stable and falling; - formed on new products that have no analogues; - unstable; - solidly formed (considered); - alternative (spontaneous); - basic (in places of residence); - migratory; - mobile. The market situation also reflects the indicator of market capacity (characterizes the volume of goods sold on the market, usually within one year), i.e., this is the quantity or cost of goods that the market can absorb, under certain conditions, for any period of time. The market capacity is determined by the formula Market capacity = National production volume + Import volume - Export volume. The study of demand for a particular product is also necessary to determine the market capacity of this product in order to determine the volume of sales of goods by a particular company or the state as a whole, so the market capacity can also be expressed as follows: Market capacity = ? (number of the i-th group of consumers x Consumption coefficient (or standard) in the base period for the i-th group) Coefficient of elastic demand from prices and incomes + The volume of the normal insurance reserve of the goods (Market saturation - Physical depreciation of the goods - Obsolescence of the goods) - Alternative market forms of satisfaction of needs - The share of competitors in the market. Market saturation is the volume of goods already available to consumers, in particular in the household. The market capacity is the higher, the lower its saturation, and vice versa, as the market is saturated with this product, the market capacity decreases. The per capita consumption index is often used as an indicator of market saturation as one of the market capacity elements. 
It should be noted that if the index of per capita consumption of foodstuffs is relatively stable, then this serves as evidence of the absence of prospects for significant growth within consumption, i.e., in excess of population growth. In turn, the low average share of expenditures on food indicates a high standard of living of the country's population. 12.2. Statistical analysis of the efficiency of the functioning of enterprises of different forms of ownership Efficiency is a socio-economic category inherent in all types of social development. At all times, achieving efficiency meant getting the maximum results per unit of costs associated with production, or ensuring the minimization of costs per unit of result. Efficiency should also be assessed in relation to the available material and labor resources. The ratio of the achieved result (effect) to the amount of resources shows the effectiveness of the implementation of the opportunities contained in the resources, the efficiency of the use of resources. Changes in these relationships over time reflect an increase or decrease in the level of cost or resource efficiency. Efficiency is evaluated at all levels of activity of a company, stock exchange, trading enterprise, regardless of the form of ownership, type of activity and industry affiliation. There is a unity of general methodological principles for assessing the effectiveness of the functioning of enterprises based on the use of statistical indicators and methods. The most general or fundamental model of statistical evaluation of the effectiveness of the functioning of the enterprise includes the analysis and evaluation of the financial and economic condition of the enterprise. The possibility of carrying out such an analysis is ensured by conducting reliable management and accounting records at the enterprise. For this, such forms of management and financial accounting and reporting as financial statements, budgets, payment calendars, business plans, reports on the cost structure, reports on sales volumes, reports on the state of stocks, balances of working capital, statements of breakdowns of debts of debtors and creditors, etc. The objects of statistical analysis of enterprise efficiency are: - the level and dynamics of the financial results of the enterprise; - property and financial condition of the enterprise; - business activity; - management of the capital structure of the enterprise; - management of fixed assets; - working capital management; - financial risk management; - system of budgeting and business planning; - system of non-cash payments at the enterprise. Here are the main criteria (indicators) for the effectiveness of the state or functioning of the above objects. The level and dynamics of financial results make it possible to judge the optimization of the enterprise's activities (increase in revenue and profit from the sale of products, reduction in production costs, etc.). High quality of profits, high degree of capitalization (conditional indicator), i.e. a high share of profits aimed at creating accumulation funds, a high share of retained earnings in net profit remaining at the disposal of the enterprise, indicate the possible production development of the enterprise and the growth of positive financial results in future. The optimal dynamics of financial results can be judged on the basis of the growth of profitability (profitability) of equity and borrowed capital, the growth of the total amount of profit and profit from various types of activities, the rate of capital turnover, etc. When making decisions on the capital structure, in terms of optimizing the amount of debt financing, the company's ability to service and repay debts from the amount of income received (sufficiency of income received), the magnitude and stability of projected cash flows are taken into account. In addition, industry, territorial and organizational features of the enterprise, its goals and strategies, the existing capital structure and the planned growth rate should be taken into account. To manage capital invested in fixed assets (fixed capital), they study the efficiency of using fixed assets, which is characterized by indicators of capital productivity, capital intensity, profitability of fixed assets, relative savings in fixed assets as a result of an increase in capital productivity, an increase in the service life of labor tools, etc. The efficiency of working capital management is characterized by indicators of turnover, material consumption, reduction of resource costs for production, etc., the use of scientifically based methods for calculating the need for working capital, compliance with established standards, an increase in the share of assets with minimal and low investment risk. A brief statistical review of the efficiency of the enterprise's functioning includes the analysis and evaluation of the following general indicators: - technical and organizational level of the enterprise functioning; - indicators of the efficiency of the use of production resources: capital productivity of fixed production assets, material intensity of production, labor productivity, volume and quality of products, resource costs for production, fixed and current assets advanced for economic activity, turnover of stocks and materials; - results of core and financial activities; - profitability of products, turnover and profitability of capital, financial condition and solvency of the enterprise. A more detailed analysis involves the identification (calculation) of the critical and most optimal values of the above indicators, their comparison with the actual values. It is extremely important to assess changes in each indicator for the analyzed period, assess the structure of indicators and its changes, evaluate the dynamics of indicators, identify factors and causes of changes in indicators. For example, as part of a profit analysis, you need to perform: - analysis and assessment of the level and dynamics of profit indicators; - factor analysis of profit from the sale of products (works, services); - analysis and assessment of the use of net profit; - analysis of the relationship between costs, production (sales) and profits; - analysis of the relationship of profit, movement of working capital and cash flow. In the analysis of business (economic) activity and efficiency of the enterprise, the following indicators are also used: - the share of the active part of fixed assets, depreciation, retirement and renewal of fixed assets; - provision of reserves with sources of their formation; - general liquidity indicator, coefficients of current liquidity, urgent liquidity, absolute liquidity; - the level of fulfillment by the enterprise of its payment obligations, the level of fulfillment of payment obligations to the enterprise. Currently, enterprises operate in market conditions, where there is fierce competition. Today, it is impossible to do without an active position of the organization in doing business. This position presupposes the existence of a strategic goal for the functioning of the enterprise, which is dynamic, efficient and rational development. The assessment of the degree of fulfillment of this task is the subject of a statistical study of the effectiveness of the functioning of subjects of market relations. 12.3. Fixed assets statistics Fixed production assets (OPF) - this is part of the production assets of the enterprise, which is materially embodied in the means of labor; retains its natural shape for a long time; transfers the cost in parts to the product and reimburses it only after several production cycles. The most important tasks of statistics of fixed assets (F) are the study of the labor force of fixed assets, the establishment of the presence and study of the composition of fixed assets, the study of the movement, use and condition of fixed assets. Fixed assets, depending on participation in the production process, are divided into fixed production assets and fixed non-production assets. Fixed production assets (OPF) include funds that are directly involved in the production process or create conditions for the production process (for example, machinery and equipment, transmission devices, vehicles, buildings, structures, etc.). Fixed non-production assets are household and cultural facilities that are on the balance sheet of the enterprise. They are objects of long-term non-industrial use, retaining their natural form and gradually losing value. These include funds for housing and communal services, science, health care, etc. These funds do not create consumer value. Depending on the degree of participation in the production process, fixed production assets are divided into active and passive (buildings and structures). The ratio of different groups of OPFs in the total value, expressed as a percentage, constitutes the structure of the OPF. The specific weight of the active part of the OPF characterizes the progressivity of the structure of the OPF. Various indicators are used to characterize fixed production assets. Indicators of the state and dynamics of fixed production assets. A complete picture of the receipt and disposal of fixed assets is given by their balance sheet, which contains data on the receipt of fixed assets from various sources and on their disposal for various reasons. The balance sheet can be drawn up both for all fixed assets and for their individual types. Balance sheets are drawn up for branches, enterprises and the national economy as a whole. The balance sheet of fixed assets at full historical cost has the form: Fk \uXNUMXd Fn + V, where Фк - residual value of funds at the end of the year; Фн - the residual value of funds at the beginning of the year; P - receipt of fixed assets at residual value during the year; B - disposal of fixed assets at the residual initial cost during the year. The intensity of movement of fixed assets and their individual types is calculated by the following coefficients: - receipt coefficient - the share of all received (P) in the reporting period FC in their total volume at the end of this period (Fc): 
- retirement rate - the ratio of the value of all fixed assets retired over a given period (B) to the value of fixed assets at the beginning of this period (Fn): 
In the balance sheet of fixed assets at the residual initial cost, in addition to the receipt and disposal of objects, it is necessary to take into account the decrease in the residual value of fixed assets occurring during the reporting year due to their depreciation. The basis of the FC balance at the residual initial cost is the equality 
where Ap - depreciation for renovation; - the depreciation coefficient is calculated on a certain date as the ratio of the amount of depreciation of fixed assets (I) to their total cost (F): 
- the difference between 100% and the depreciation coefficient gives the value of the asset life factor and reflects the share of the unworn part of fixed assets. In this regard, you can use another option for calculating the coefficient of validity: 
Indicators of availability and structure of fixed production assets. The availability of fixed assets at the end of each month is determined according to the balance sheet, and the average annual cost is determined as the average chronological of the monthly data on their availability. Indicators of the use of OPF and capital-labor ratio. The general indicator of the use of OPF is the return on assets - the ratio of the volume of products produced in a given period (O) to the average cost of OPF (F) for this period: 
The return on assets shows how much production is produced in a given period for 1 rub. value of fixed assets. Capital intensity (reciprocal) characterizes the cost of OPF per 1 rub. manufactured products: 
With a decrease in capital intensity, there is an economy of labor embodied in fixed assets participating in production. The value of capital productivity and capital intensity is influenced by the capital-labor ratio (FV). It is calculated according to the formula where is the average number of employees. The capital-labor ratio is used to characterize the degree of equipment of the work of workers. With the rational use of fixed production assets, there is an increase in the production of the social product and national income, savings in living and materialized labor, which lead to a reduction in total costs per unit of output. The economic effect of increasing the level of use of fixed assets is the growth of social labor productivity. If the level of use of fixed production assets increases, then there is an increase in labor productivity in the economy. 12.4. working capital statistics Revolving funds are funds of enterprises that are entirely consumed during one production cycle, change their natural-material form and fully transfer their value to finished products. Working capital includes: - raw materials and materials. Raw materials are products of the extractive industry and agriculture that enter the subsequent industrial processing, the materials are included in the product as its main part, that is, they form the basis of the product; - auxiliary materials that are necessary to assist the production process (lubricants) or to attach to the base materials to give the product the desired properties (varnishes, paints, polishes, etc.); - purchased semi-finished products; - semi-finished products of own production; - fuel; - electricity; - spare parts for current repairs; - container and container materials; - low-value and fast-wearing items with a service life of less than one year (about 10% of all working capital); - work in progress - this is a product that has been started, but not yet completed in one production cycle (about 19%). Territorial disunity of enterprises and economic independence require that raw materials and supplies be at the enterprise in the form of production reserves. They are necessary for the smooth operation of the enterprise, there are several types of them: - production stocks are raw materials, materials, etc., located in the warehouses of the enterprise and intended for production consumption, but not yet entered into the production process; current stocks that uninterruptedly satisfy the current production need for material resources between two successive receipts of these resources; insurance stocks created in case of unforeseen circumstances; seasonal stocks formed at enterprises dependent on raw materials, the production or supply of which is of a seasonal nature (fish, agricultural products, etc.); stocks of work in progress and stocks of finished products in the warehouses of enterprises. These types of stocks can flow smoothly from one type to another. They are very mobile. This indicates a continuous, uninterrupted course of production and consumption. To characterize the cost of inventory turnover of various material resources, several interrelated indicators are used. - The turnover ratio shows how many times during the reporting period the stock of this type of working capital was updated (the higher this ratio, the better for the enterprise): 
where o is the average balance of material resources; TP - commercial products. - Another relative indicator characterizes the duration of one turnover in days and represents the ratio of the duration of the period (T) to the turnover ratio: 
The specific consumption of raw materials, materials, fuel shows the average consumption of this type of working capital. Specific consumption is the amount of material consumption for the manufacture of one unit of output: 
where - the amount of consumption of materials (kg, m, pcs.); q is the number of units of this type of product, pcs. - Material intensity - the cost of material resources spent on the production of a unit of output: 
where C - actual reserves in monetary terms; Q - the volume of production in value terms. Reducing the material consumption of products is a good indicator of production efficiency. Revolving funds include that part of the means of production, which is formed by the objects of labor. Working capital, which includes inventories, unfinished products, including deferred expenses, form the normalized part of working capital. Deferred expenses are the costs associated with the prospective preparation of the production of new types of products and their development. The sources of the formation of working capital, and therefore working capital, are: the authorized capital, profit, stable liabilities, short-term bank loans, funds raised from other organizations, as well as budget allocations, etc. The cost of consumed working capital is reimbursed in the sale of products immediately. This allows you to purchase them again for a new production cycle. The main differences between working capital and fixed assets: - elements that are part of fixed assets are not included in the product being created. Fixed assets are involved in a number of production cycles. Working capital is completely consumed within one production cycle and turned into a finished product; - circulating assets fully transfer their value during one production cycle, while the cost of fixed assets is partly included in the cost of the product being created; - after the sale of products, the cost of fixed assets is reimbursed in the part that corresponds to the standard level of their depreciation, and the cost of working capital is reimbursed immediately in the process of selling products. 12.5. Statistics of the cost of goods and services The statistics of the cost of goods and services is based on accounting data, the task of which is to calculate the total amount of costs, group them by type and determine the cost of a unit of production. Analyzing accounting and reporting data, statistics solves the following main tasks in this area: - masters the cost structure by types of costs and shows the impact of modifying the cost structure on the cost dynamics; - the final characteristic of the performance of production tasks in terms of the dynamics of the cost of production; - considers the factors influencing the dynamics of the cost price. But in order to solve these problems of statistics on the cost of goods and services, it is necessary to have a clear knowledge of the theoretical and practical content of the cost as an economic category and as a means of influencing the results of economic activity. The cost of goods and services is the direct costs associated with the production of a product, as well as all types of costs incurred in the course of the production and sale of a certain type of goods and services. The cost of goods and services includes: - the cost of materials; - labor costs; - variable costs: material costs, depreciation of fixed assets, salaries of key and auxiliary personnel, overhead costs directly related to the production and sale of goods and services. Each enterprise in the production of goods and services incurs costs. The sum of all costs in monetary terms associated with the production and sale of products is the cost of production. Classification of costs by elements: - raw materials and materials; - purchased parts, semi-finished products and components; - auxiliary materials; - fuel and energy from outside; - wages (basic, additional, etc.); - depreciation of fixed assets; - other cash expenses. There are two types of approach for classifying production costs into cost items. By intended use: direct, costs of one type (all wages, all materials, etc.) and indirect costs for equipment maintenance. By the nature of the impact, constant and variable. The constants do not depend on the volume of production, while the variables do. Production costs act as the cost of production, which is determined by costing items. The composition of the costs included in the cost of production is established by law, that is, it is regulated by the state. The study of cost statistics, the identification of the reasons for the deviation of the actual cost from the normative one, as well as the substantiation of probable ways to reduce production costs per unit of marketable output is carried out on the basis of the index method. As already mentioned, the index is an indicator that is used for a generalizing characteristic, which means that the goods or services being compared must be the same in terms of the nature of their consumer value and production technology. Topic 13. STATISTICS OF COMMODITY TURNOVER AND PRICES 13.1. Turnover statistics Under the conditions of commodity production, a necessary condition for the process of reproduction is the exchange of goods. To bring goods from the producer to the consumer and thereby satisfy his needs is the main goal of an economic entity operating in the field of trade. The exchange of goods is carried out with the help of money, which is a measure of the value of goods and serves as a means of circulation. The movement of goods from the producer to the consumer in the economic space takes place in the form of trade. Trade turnover is a process of buying and selling, which is based on the transfer of ownership of a product in exchange for its monetary equivalent. An important task of economic statistics in this area is the definition of turnover as an object of statistical research, and therefore, the definition of its subject and methods of quantitative and qualitative analysis. The subject of trade turnover statistics are mass processes and phenomena of the movement of goods from producer to consumer and the exchange of goods for money that can be quantified. Trade turnover in the modern economic space is a complex economic process of exchanging the results of the activities of separate economic entities with its inherent general trends and patterns. The purpose of turnover statistics is a comprehensive quantitative description of the process of circulation of marketable products, revealing leniye of the main tendencies and regularities of its development. The tasks of trade turnover statistics are the collection, generalization and analysis of information on the trade turnover of enterprises of different forms of ownership, channels of goods distribution throughout the country as a whole and regions; analysis of volume, commodity structure, turnover dynamics. When studying the turnover, it is convenient to use groupings. By category, the turnover is divided into gross and net, wholesale and retail. According to the organizational forms of trade, the turnover of retail and wholesale, procurement and marketing organizations is distinguished. According to the forms of commodity circulation, the turnover is warehouse and transit. According to the natural-material composition, the turnover is studied by commodity groups. In addition, they study the turnover of enterprises of various forms of ownership. In the methodology of the statistical analysis of trade, a whole system of indicators characterizing it has been developed. Gross turnover is the sum of all sales of goods in the process of moving from producers to consumers. This figure depends on the number of sales. If we exclude resales from it, we get a net turnover. One of the indicators characterizing the rationality of the organization of the process of product distribution is the coefficient of links. It is calculated as the ratio of gross to net turnover. Trade turnover per capita is calculated as the ratio of trade turnover to the average population for the period. An important qualitative characteristic of trade turnover is the indicators of its structure. These include the absolute indicator of the sale of an individual product or group and relative indicators: the share (share) of each product or group in the total turnover, the ratio of the sale of two products. Indicators of commodity stocks at the beginning and end of the period and the average are used when calculating the indicator of the provision of commodity turnover with commodity stocks. Turnover in supply days is calculated as the ratio of the product of stocks at the beginning of the period and the number of days to turnover. The rate of turnover is calculated as the ratio of the volume of turnover for a given period to the value of the average inventory for this period. The reciprocal indicator is called the time of circulation of commodity stocks. The index method is widely used in the study of trade turnover. This method allows you to evaluate the vector and speed of development of trade. The change in turnover over a certain period of time is characterized by the ratio of the current turnover to the base. Any previous period comparable to the current one is chosen as the comparison base. The turnover index is a relative indicator that characterizes the change in the value of the aggregate of goods sold, the cash proceeds of trade or the expenses of buyers for the purchase of goods in the current period compared to the base period, due to the combined influence of changes in quantity and prices. In the turnover statistics, the following indices are calculated. The share index - an indicator of changes in the commodity structure - is calculated as the ratio of the shares of an individual product or group in the current period to the base one. The index of trade turnover localization is the ratio of the shares of trade turnover and the factor sign in the total volume throughout the territory. The index of trade turnover per capita is the ratio of trade turnover per capita of the current period to the base one. It eliminates the influence of population dynamics. The index of the physical volume of trade reflects the impact of changes in the number of goods and their range on the dynamics of the cost of goods. The territorial turnover index compares the turnover of different regions and is calculated as the ratio of the average per capita turnover of one region to another. Another method of studying the turnover is the method of studying the supply of goods. Important characteristics of trade are the rhythm and uniformity of the supply of goods. The uniformity of supply is the receipt of goods in equal lots at regular intervals. Rhythm of delivery is the observance of the terms and sizes of delivery stipulated by the contract, taking into account the seasonal and cyclical characteristics of production, sale and consumption. At the same time, the supply arrhythmia coefficient is considered, which characterizes the degree of deviation of the actual delivery from the contractual sizes for the agreed delivery periods. The supply variation coefficient is calculated as a percentage of the standard deviation of the actual supply from the average supply level to this average level. It is the reciprocal of the uniformity factor. In general, the turnover indicators meet the needs of government and business statistics. Thus, the statistical characteristic of trade turnover has an economic and social orientation. 13.2. inventory statistics Commodity stocks are in the sphere of commodity circulation from the moment they are received from production until the moment they are sold by the end consumer. Commodity stocks are concentrated in various channels of distribution. Their size for each type of goods is determined: - features of the goods; - assortment of goods; - production conditions; - conditions of transportation; - storage conditions; - the nature of the demand. The most important for improving the efficiency of commercial activity belongs to the operational maneuvering of commodity stocks, their rational distribution throughout the country, enterprises and organizations. In statistics, a system of indicators of the rate of circulation of inventory is calculated, primarily the indicator of the rate of turnover (inventory turnover) - N. This indicator is calculated as the ratio of the volume of trade (TO) for a given period to the value of the average inventory W for this period: 
i.e., indicates how many times during the period, on average, the inventory turned around. Its inverse is the indicator of the time of circulation of commodity stocks (in days) - t. This indicator is determined by the ratio of the average inventory to the amount of one-day turnover: 
where D is the number of days in the period. In statistics, much attention is paid to the study of the dynamics of stocks and the speed of their circulation in order to identify the main trends and opportunities for further acceleration of the circulation time. The study of the dynamics of indicators of commodity stocks is carried out on the basis of the index method. The index of the total volume of commodity stocks characterizes the change in commodity stocks for a certain period of time: 
where 3 is a one-day supply. The difference between the numerator and denominator (?31D1 -?30D0) will show the absolute increase or decrease in the value of reserves. The impact of changes in the stocks of individual groups of goods on the dynamics of the total volume of stocks is quantitatively measured using the stock index in days: 
at the same time, the numerator indicates the amount of commodity stocks of the reporting period, the denominator is a conditional value showing what the amount of commodity stocks would be in the reporting period if the availability of commodity stocks remained at the level of the base period. The difference (? D131 -? D031) will show the increase or decrease in stocks due to changes in their level in days. The impact of changes in the sale of individual goods on the dynamics of the total volume of commodity stocks is calculated using the overnight turnover index: 
The difference between the numerator and the denominator (?Z'1D0 -?Z'0D0) will show an increase or decrease in inventories due to an increase in turnover. There is a relationship between the indices: 
Of particular importance for studying the dynamics of commodity stocks is the calculation of the index of the physical volume of stocks, which characterizes the dynamics of stocks without taking into account the impact of price changes, based on the use of comparable prices. Theoretically, its construction looks like this: 
In inventory statistics, it is also necessary to take into account the assessment of the uniformity of the supply of goods. It shows how evenly (in equal batches) for equal periods of time this or that product is supplied. The analysis of the uniformity of supplies is usually carried out using the variation indicators for the quarter in the context of 15 days. The balance of wholesale trade is based on the availability of commodity resources and changes in their value. The balance sheet reflects: - stocks of goods at the beginning of the reporting period; - receipt of goods by source; - consumption of commodity resources (in the areas of supply, through write-offs by acts, due to losses from markdowns, regrading or other parameters). Reflects inventory at the end of the reporting period. Balances can be drawn up using the gross turnover method, when all data on the supply of goods are summed up. ditch, and according to the net turnover method, when the data on the supply of all goods are summarized minus intrasystem release (turnover). When analyzing inventory statistics, retail trade statistics are considered as a constituent element. The tasks of retail turnover statistics include collecting data on the retail turnover of enterprises, developing indicators of retail turnover (total for the country, region, group of enterprises, average per enterprise, total for a particular type of product, average per capita); analysis of the influence of factors on the dynamics of retail turnover. The retail trade includes:
When studying retail turnover, it is advisable to analyze the fulfillment of the task for turnover. 
The seasonal aspect of the dynamics of retail turnover is studied using seasonality indices, in addition, the patterns of development of retail turnover are revealed. For analysis, only data comparable in time and space are taken. Comparability in time means that the compared indicators are taken for the same periods of time. Comparability in space implies the need to take into account changes in the area of activity of the enterprise, its organizational structure and specialization. To identify the general trend in the development of retail turnover, the following methods are used: the method of enlarged intervals; moving average method; analytical alignment method. When analyzing the dynamics of commodity stocks, it is necessary to take into account the influence of the volume and structure of the population's demand, the volume and structure of the population's income, and changes in commodity turnover indicators. 13.3. Statistical analysis of the quality of goods and services Market trends of the last decade have led to a significant increase in the level of requirements for the quality of products (works, services). The problem of maximum quality improvement is very relevant. Losses from the production of low-quality goods and services are measured in millions of dollars. The importance of quality control methods at the current stage of the economy is assessed by analysts as critical. For all manufacturing processes, there is a need to establish product performance limits within which the manufactured product satisfies its intended purpose. The main "enemies" of product quality are the following indicators: - deviations from the values of planned product specifications; - too high variability of the actual characteristics of products relative to the values of the planned specifications. In the early stages of debugging a production process, experiment design methods are often used to optimize these two indicators of production quality. Usually, any machine or machine used in production allows adjustments to be made that affect the quality of the product being produced. By changing the settings, the engineer seeks to achieve the maximum effect and along the way to find out which factors play the most important role in improving product quality. An important point in this matter is to check the quality of goods. The quality of goods received from production, especially food products, is controlled, and the current statistical reporting reflects the following data: goods received from production or other sources; factually verified; percentage of those checked in the total admission; returned to suppliers; the proportion of those who did not pass certification. In statistics, individual and general coefficients are calculated, for example, an individual grade coefficient is determined for each product or assortment subgroup: 
When constructing a general grade index, the actual turnover in the number of goods sold acts as weights-components. The current quality control of products is carried out in the process of its production. For this, special procedures are designed - methods of quality control. Particularly intensive quality control methods are used in the USA, Germany, Japan. The general approach to current quality control is as follows. In the production process, samples of products of a given volume are selected from the manufactured products or incoming raw materials. After that, diagrams of the average values and variability of the sample values of the planned specifications in these samples are plotted on specially lined paper, and the degree of their closeness to the planned values is considered. If the charts show a trend in the sampled values, or if the sampled values are outside the specified limits, then the process is considered to be out of control, and the necessary actions are taken to find the cause of the disorder. Such special charts are called Shewhart control charts. It is also useful to consider a range plot. The range is the difference between the maximum and minimum values in the sample. The pragmatic value of this characteristic is that it serves as a measure of variability. According to the location of the points on the range graph, a decision is made about the randomness or systematic deviation in the quality of the product. Manufacturing quality control engineers face another common problem, which is to determine how many items in a batch need to be examined in order to be able to say with a high degree of confidence that the entire batch is of acceptable quality. For this, a sampling procedure is developed that ensures the required quality. Sampling procedures are used when it is necessary to decide whether a batch of products meets certain specifications without examining all the products. Such procedures are called statistical acceptance control. An obvious advantage of sampling over complete or complete inspection of products is that the study of only a sample (rather than the entire lot) requires less time and financial costs. Finally, from a production management point of view, the rejection of an entire lot or shipment on the basis of random control forces manufacturers and suppliers to adhere to stricter quality standards. If we take repeated samples of a certain size from the population and calculate the average values of the studied characteristics of the products, then the distribution of these average values will approach a normal distribution with a certain average value and standard error. But in practice, it is not necessary to take repeated samples from the population in order to estimate the mean and standard error of the sampling distribution. Given a good estimate of how much variability (standard deviation, or sigma) is in a given population, one can infer the sample distribution of the mean. Already this information is sufficient to calculate the sample size required to detect some change in quality compared to the given specifications. Typically, specifications specify a range of acceptable values. The lower limit of this interval is called the lower tolerance limit, and the upper limit is called the upper tolerance limit. The difference between them is called the tolerance range. The simplest indicator of the suitability of a manufacturing process is potential suitability. It is defined as the ratio of the tolerance range to the process range. When using rule 6, this indicator can be expressed as: 
This ratio expresses the proportion of the range of the normal distribution curve that falls within the tolerance limits, provided that the average value of the distribution is nominal, i.e. the process is centered. In many countries, before the introduction of statistical quality control methods, the usual quality of production processes was about Cp = 0,67. Thus, 33% of all products fell outside the tolerance limits. Ideally, it would be good if Cp = 1, i.e. one would like to achieve a level of process suitability in which almost none or none of the product would fall outside the tolerance. It should be noted that high process suitability generally results in lower product costs, if the claims costs associated with poor product quality are taken into account. Although achieving high product quality increases production costs, it must always be remembered that the costs of poor quality, loss of market share, and the like can far outweigh the cost of quality control. According to statistics, most businesses currently operate at level 3. This entails a huge number of errors, many of which lead not only to business losses, but also to human casualties. Today, many companies decide that the level of quality, which is measured in units of percent, is no longer acceptable, and set themselves a benchmark in the field of quality - at the level of a thousandth of a percent, focusing not on increasing capital investments, but on improving the production management process. It is becoming clear to many that minimizing losses will also lead to minimizing new capital investment. The current level of technology eliminates the old level of acceptable product quality. Now business demands almost perfect quality. 13.4. Market Infrastructure Statistics Market - a system of economic relations that provides contacts between sellers and buyers, where a large number of transactions are made, the object of which is a variety of goods, ranging from the most complex devices stuffed with electronics to a simple loaf of bread, as well as a wide range of industrial and consumer services. The market has its own infrastructure, the analysis of which makes it possible to make the process of its functioning and development more manageable and economical. Market infrastructure - a set of interconnected institutions and means that organizationally and materially provide the main market processes: mutual search for each other by sellers and buyers, commodity circulation, advertising, exchange of goods for money, as well as financial and economic activities of market enterprises. The market infrastructure includes: - trade-warehouse and administrative premises and their equipment; - advertising equipment; - computer and other information and computing equipment; - trade and cash equipment, service equipment; - means of communication and vehicles; - labor resources. The infrastructure as a whole and its elements can be measured in monetary terms, taking into account the type, quality and depreciation. Individual elements of infrastructure and its types are measured in natural units. Statistics studies the infrastructure of the market as an independent subject. The subject of market infrastructure statistics are mass phenomena and the processes of its formation and functioning, including the material and technical potential and labor contingent of sales, trade and services, electronic computing and information equipment, as well as vehicles and other types of support for market activities that can be expressed quantitatively. The necessity and importance of studying the infrastructure and its elements is determined by the significant role it plays in the market process. For state statistics, the market infrastructure, regardless of the form of ownership, is part of the national wealth and production potential of the country. In turn, for an entrepreneur, the need to study the infrastructure is due to the fact that it, in essence, is an organizational and technological tool for performing marketing functions and implementing the market process. The main objectives of market infrastructure statistics are to assess the state and capabilities of the material and technical base, to study the potential for ensuring the movement of goods and the sale of services, and to characterize the effectiveness of their use. The implementation of the tasks, goals and characteristics of the infrastructure and its elements is carried out using a system of statistical indicators. It includes: - the efficiency of the use of fixed assets by trade enterprises, mass catering and services: 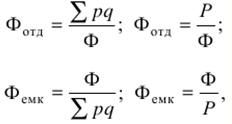
where Fodd - return on assets; Femk - capital intensity; - cost of fixed assets; ?pq - turnover; - profit; - the size of the enterprise, trade unit: store and service enterprise - area (for a mass catering enterprise - the number of places for visitors, for a warehouse - area, or capacity): 
where M is the area of the enterprise, m2; S is the number of consumers; k - capacity of the enterprise; - the coefficient of influence of the progressiveness of the forms of trade on the throughput. It is calculated as the arithmetic weighted average of the points of consumer time spent by experts assigned to each form (the traditional form is equal to one), weighted by the shares occupied by each form in the turnover. 
where W - storage capacity; Z - commodity stock; - density standard for the placement of commodity stock per 1 m2 of a warehouse; V is the coefficient of uneven receipt of goods at the warehouse; K is the normative coefficient for the use of storage space volume; h - warehouse height; Mskl - the area intended for warehousing; Мtot - the total area of the warehouse; - the share of the area of the trading floor (hall for visitors) in the total area of the enterprise: 
where Mtz is the area of the trading floor; Mtot - the entire area of \uXNUMXb\uXNUMXbthe store; - throughput of the enterprise: 
- for interactive marketing - the number of websites associated with commercial activities; - number of electronic stores; - the time spent by buyers on the purchase of goods: on the way to the trading enterprise and back, in the queue for service, on the choice of goods, on the release of goods, at the settlement node (in service enterprises: receiving and placing an order for the manufacture and repair of a product, for issuing or execution of an order for the provision of a service); - the number and share in the total number of universal, specialized and mixed enterprises: 
where Nsp is the number of specialized enterprises; Mtot - the total number of enterprises; - density coefficients of trading enterprises: 
(number of enterprises or their area, locations, etc. per 10 inhabitants); - the number of vehicles, means of communication, information and computer technology per enterprise (firm) or 1 million rubles. turnover; - the number of employees (total, by specialty and position), the number of employees per enterprise, 1 m2 of area, including the trading floor, turnover per employee; - the number of equipment, mechanisms and other equipment (including cash registers): by types and types, in total, per enterprise, per 1 million rubles. turnover. 13.5. Price statistics Price statistics - one of the sections of economic statistics that studies prices in various sectors of the economy: industry, agriculture, construction, tariffs for various services. Price statistics explores their level, structure, patterns of change, dynamics, studies the principles and methods of registering prices and tariffs, studies price fluctuations and ratios, studies information processes and indexation of the population's monetary income. Price statistics pays special attention to the problems of assessing the impact of the consumer price index on the volume, structure of consumption and the level of real incomes of various social groups of the population, explores price problems in specific conditions, taking into account the place, time and period of economic development. There are three stages of statistical research of prices: statistical observation, summary and grouping of observations, analysis of the obtained generalized materials and indicators. Price registration can take place in two ways. In conditions of stable prices set by the state, statistical accounting was applied. With the transition to a market economy, the domestic economy began to use the sampling method used in countries with a flow economy and based on the principles of representative statistics and comparability. At the second stage, representative data are systematized and generalized. At the third stage of the statistical study, the summary statistical material on prices is analyzed, trends and patterns are identified, their characteristics and evaluation are given. In the course of a statistical study of prices, the price level and its dynamics are calculated. The price level is a general indicator that characterizes the state of prices for a certain period of time, in a certain territory, in terms of the totality of goods and commercial types with similar consumer properties. The price level shows the available variation and appears as an average value. It is possible to allocate individual, average and generalized price levels. The individual price level is the amount of money paid in the market for a commodity unit. The average price is a generalized characteristic for the prices of homogeneous product groups, for prices that vary in time or space. Average prices are calculated for a certain period of time (for a month, quarter, year), by territory (with differences in individual territorial units in price levels for a given type of product), by groups of goods (average price for goods of various categories and varieties). In the economic and statistical analysis of prices, various statistical methods are used, among which the index method occupies a special place. Various types of dynamic and territorial indices are widely used in price statistics. The first serve to characterize the change in the level of certain types of prices (purchase, wholesale, retail, etc.) over time, the second - to express the ratio, the degree of difference in simultaneously existing price levels of identical goods in different cities, economic regions, social groups. To represent the dynamics of prices for any product, it is enough to have prices for compared periods (or for certain dates). A simple ratio of the new price to the previously existing one makes it possible to establish not only the direction of the change in the price of a given commodity, but also the degree of its change. Such a relative value is usually called an individual price index (i = p1 / p0 ). Common types of price indices are aggregate and harmonic mean. Most price indices are calculated using an aggregate formula with current period weights: 
where P1 and po are the prices of goods in the current and base periods; d1 - the number of products of the current period. Each part of this index has a clear economic content: ?Р1д1 - the actual volume of sold (or produced) products of the current period, ?Р0Ч1 - the conditional volume of sales (production) of the products of the current period at prices of the base period. The aggregate price index is calculated in all cases where there are reported data on the quantity of sold (produced) products in physical terms. If the accounting of products is carried out only in cost form, then the calculation of the price index is carried out according to the formula of the average harmonic index: 
where i =p1/p0 In terms of economic content, these price indices are identical. Both forms of the index characterize the relative change in the average price level. When choosing the form of the index, they primarily proceed from the specifics of pricing for specific goods and the availability of initial data in the reporting obtained on the basis of complete or selective accounting. Price indices are calculated both for the entire set of a certain type of prices, and for its individual parts. In practice, annual indices are calculated for each type of price, as well as for shorter periods - quarterly and monthly. In the analysis of price dynamics, along with indices, dynamic series of prices, average group prices, data on costs and the price structure of individual types of goods are widely used. Various methods of calculating average prices are used, the choice of which depends on the availability of information. For a number of economic calculations, average group prices are widely used, for example, the price of 1 ton of meat of all types and varieties. They can be calculated as a weighted arithmetic mean or as a weighted harmonic mean. In addition, the average group price depends both on the price level of each product type and on the sales structure - the share of each product type in the sales volume. The price level is inextricably linked with the purchasing power of the population's income - a value measured by the commodity equivalent of money income and representing the relative price level. The purchasing power of money income shows the ability to buy any amount of goods for the amount of average per capita money income, average wages, average pensions, etc. The calculation can be carried out both for the entire population and for individual social groups in the country as a whole or for individual regions: 
where PS - purchasing power; D - per capita cash income; P - the average price of the goods. Thus, the price expresses the value of goods in monetary units, and purchasing power is the value of money expressed in goods, that is, it shows how many goods can be bought for one monetary unit. With the growth of the purchasing power of the ruble, it is necessary to use the level of only consumer prices, and it should be borne in mind that the purchasing power of money is influenced by prices alone only if the type and quality of goods, the price structure, and the absence of a black market remain unchanged. The price level is influenced by diverse assortment shifts: the emergence of new types of goods, the disappearance of old ones, the change in the share of individual goods in the structure of consumption, seasonal price fluctuations. Literature 1. Eliseeva I.I., Yuzbashev M.M. General Theory of Statistics: Textbook. M., 1998. 2. Efimova M.R., Petrova E.V., Rumyantsev V.N. General theory of statistics. M., 1996, 2002. 3. Course of socio-economic statistics / Ed. M.G. Nazarov. M., 2000. 4. General theory of statistics: Textbook / Ed. Spirina, O.E. Batina. M., 1994. 5. General theory of statistics: Textbook / Ed. O.E. Batina. Spirin. 5th ed. M., 1999. 6. Workshop on the theory of statistics: Textbook / Ed. prof. Shmoylova. M., 1998, 2000. 7. Sidenko A.V., Popov G.Yu., Matveeva V.M. Statistics: Textbook. M., 2000. 8. Socio-economic statistics: Textbook / Ed. B.I. Bashkatov. M., 2002. 9. Statistics of goods and services: Textbook / Ed. I.K. Belyavsky. M., 2002. 10. Economics and statistics of firms / Ed. S.D. Ilyenkova. M., 2000. Notes 1. Theory of Statistics: Textbook / Ed. prof. R.A. Shmoylova. 3rd, ed. revised M., 2001. S. 260. 2. The course of socio-economic statistics: Textbook for universities / Ed. prof. M.G. Nazarov. M., 2000. S. 407. 3. Economic statistics: Textbook / Ed. Yu.N. Ivanova. 2nd ed., add. M., 2002. S. 480. 4. Zherebin V.M., Ermakova N.A. The standard of living of the population - as it is understood today // Questions of statistics. 2000. No. 8. P. 4. 5. Social statistics: Textbook / Ed. I.I. Eliseeva. M., 1997. S. 69-70. Author: Neganova L.M.
▪ Fundamentals of social work. Crib ▪ Experimental psychology. Lecture notes
Artificial leather for touch emulation
15.04.2024 Petgugu Global cat litter
15.04.2024 The attractiveness of caring men
14.04.2024
▪ section of the Electrician website. Article selection ▪ article The Russians are coming! Popular expression ▪ Why did Hercules have to fight the Amazons? Detailed answer ▪ article Automated battery charger. Encyclopedia of radio electronics and electrical engineering
Home page | Library | Articles | Website map | Site Reviews
www.diagram.com.ua |


 See other articles Section