|
|


 Arabic
 Bengali
 Chinese
 English
 French
 German
 Hebrew
 Hindi
Hindi Italian
 Japanese
 Korean
 Malay
Malay Polish
 Portuguese
 Spanish
 Turkish
 Ukrainian
 Vietnamese
|
Lecture notes, cheat sheets
Medical statistics. Lecture notes: briefly, the most important
Directory / Lecture notes, cheat sheets Table of contents
Introduction Statistics is an independent social science that studies the quantitative side of mass social phenomena in close connection with their qualitative side. Statistics that studies issues related to medicine and health care is called sanitary or medical statistics. Medical statistics is divided into two sections: 1) population health statistics; 2) health statistics. To ensure uniform methodological approaches in information and statistical activities in medical institutions, the following concepts and accounting and statistical units have been established. The state of health is the final medical and statistical indicator that gives a medical assessment of the health of the population on the basis of a set of specially taken into account signs (presence or absence of diseases, seeking medical help, need for dispensary observation, etc.). Signs that characterize the state of health are taken into account based on the results of medical examinations, medical examinations and requests for medical help. Depending on the state of health of the person, according to preventive examinations, they are divided into three groups. Group I - healthy individuals who do not show any complaints, do not have a history of chronic diseases or dysfunctions of individual organs and systems, in whom no deviations from the established normal limits were found during the examination. Group II - practically healthy individuals with a history of acute and chronic diseases that do not affect the functions of vital organs and do not affect the ability to work. Group III - patients with chronic diseases requiring systematic medical supervision: 1) with a compensated course of the disease, rare and short-term disability; 2) with a subcompensated course of the disease, frequent exacerbations and prolonged disability; 3) with a decompensated course, stable pathological changes leading to permanent disability. When studying statistical data on the state of health of the population obtained in different territories, the correct encryption of the material is of paramount importance, since encryption errors can distort the true picture of morbidity and mortality. This requires a good knowledge of the nomenclature and classification of diseases, which are widely used in the practice of doctors of various specialties. Physical development is a complex medical and statistical indicator that gives a medical assessment of the health status of a certain team or individual based on the totality of basic anthropometric data, indicators of physical performance and nutritional status. Nutritional status is assessed by body mass index (BMI) as normal, high, including obesity, and low, including malnutrition. The incidence of the population characterizes the prevalence of diseases over a certain period of time. The unification of accounting and analysis of morbidity is achieved using the classification of diseases, injuries and causes of death, based on the international classification of diseases, injuries and causes of death (ICD). To account for the population's appeals for medical care and morbidity, the concept of "medical appeal" is used. The initial visit is considered to be the first visit of a patient for medical care to a doctor about a disease that was first detected, previously nowhere registered as chronic. All cases of the first appeal of the same person for acute illness or injury (poisoning) are primary appeals. The registration of primary appeals is also the registration of cases of new, newly diagnosed diseases among the population and serves as the basis for calculating the primary (first detected) incidence. A repeated appeal is considered to be an appeal to a doctor about an acute disease (with an extension of treatment) or the same chronic disease that has already been previously registered, including for prophylactic purposes. Primary morbidity is understood as the sum of new, nowhere previously registered and newly detected diseases. The unit of account in this case is the primary circulation. Under the general morbidity is understood the sum of all (primary and repeated) requests for medical help. If the patient has several diseases, one of them is recorded as the main (leading), the rest are taken into account as concomitant or complications. When choosing a diagnosis of the underlying disease (the main cause of death), the following rules should be followed: 1) the main should be considered the primary (in etiological and chronological terms) disease (trauma), and not its complication; 2) the diagnosis of a serious or fatal disease (injury) should be given preference over other diseases; 3) if the patient has an acute and chronic disease, the diagnosis of an acute disease should be considered as the main one; 4) the diagnosis of an epidemic disease should be given preference over diagnoses of other diseases; 5) of two diseases of the same severity, the main one is the one that affects the patient's ability to work more severely or requires more complex and prolonged treatment. When using the above scheme for choosing the diagnosis of the underlying disease (injury) and the cause of death, each of its rules comes into force if the previous one cannot be applied. In connection with the special significance for the health of the population of infectious diseases and injuries, special documents are provided for the registration of acute infectious diseases (epidemiological survey card of an infectious disease) and injuries (injury record card). The unit of account in the study of infectious morbidity is each case of an infectious disease, and in the study of injuries - a case of injury that entailed loss of work or death of the patient. When analyzing these groups of diseases, the causes and circumstances of the occurrence of infectious diseases and injuries are established; terms of isolation and hospitalization of patients; organization and implementation of preventive and anti-epidemic measures. Morbidity with hospitalization (hospitalization) is determined by the number of patients referred for inpatient treatment. In this case, the unit of account is the case of hospitalization, i.e., the placement of the patient for inpatient treatment or examination in a medical institution, regardless of whether the request for medical care was primary or repeated. One case of hospitalization may cover the period of the patient's stay in several hospitals, if inpatient treatment (or examination) took place without interruption. If the patient has several diseases, the case of hospitalization is recorded according to the final diagnosis of the underlying disease. Morbidity with temporary disability (labor loss) characterizes the amount of disability in days for medical reasons. The unit of account is the case of loss of labor - the complete release of the patient from the performance of official duties. The medical reporting documents reflect only completed cases of labor loss, indicating the duration of each of them in days and the diagnosis of the underlying disease. Disability is a long-term or permanent (persistent), complete or partial loss of ability to work due to a significant impairment of body functions caused by a disease, injury or pathological condition. The concept of "disability" has medical, social and economic aspects. The consequence of the establishment of disability is the impossibility of labor activity or a change in the conditions and nature of work. In addition, disabled people receive state social protection provided for by the legislation of the Russian Federation (pension, vocational training, employment, prosthetics, sanatorium treatment, etc. are possible). Mortality is a medical and statistical indicator, determined by the number of deaths in the reporting period. Information about the dead is taken into account by registering each death with an indication of the disease that caused the death. To take into account the volume of work of departments (offices) of the polyclinic and the characteristics of its capacity, the concept of "visit" is used. It is understood as the fact of interaction of a person who applied for medical help, consultation, obtaining a medical opinion, a medical diagnostic procedure or for another reason, with a doctor or paramedical worker during the hours provided for by the work schedule for reception at an institution or providing home care (visits, made during the day by the sick to the same doctor are counted as one visit). Visits to paramedical staff are taken into account in cases where this staff conducts self-administration of patients. Preventive examinations are included in the number of visits, regardless of whether they are carried out within the walls of medical institutions or outside them. Medical accounting units also include: a surgical operation, a postoperative complication, a diagnostic (X-ray, endoscopic, etc.) examination, a medical procedure (immobilization, dressing, physiotherapy, etc.). A surgical operation is a therapeutic or diagnostic measure associated with the dissection and injury of tissues and organs, including endoscopic operations and medical abortions. An operated patient is a patient who has undergone a surgical operation in a medical institution. Several surgical interventions (surgical operations) can be performed on one operated patient, each of which is subject to special medical records. Simultaneously with the registration of surgical operations, the type of anesthesia used, complications and the outcome of the operation are also taken into account. A postoperative complication should be considered a complication that arose in the operated patient during or after the operation, associated with the operation itself, preparation for it and postoperative management of the patient. The accounting units used to assess the quality of work of departments (offices) include: a case of discrepancy between the diagnosis of a polyclinic and the final diagnosis of a hospital, as well as a defect in the provision of medical care, indicating its nature and cause. The essence of the defect is revealed in its name. The names of defects in the provision of medical care at the outpatient stage include: late diagnosis, late hospitalization, transportation defects, unrecognized underlying disease, unrecognized fatal complication, defects in surgical treatment, errors in prescribing and conducting diagnostic and therapeutic procedures, improper prescription of drugs, defects in medical examination, incorrect expert opinion, other defects. The causes of defects include: late visit to the doctor, extremely serious condition of the patient, alcohol intoxication of the patient, atypical course of the disease, difficult conditions for providing care, objective difficulties in diagnosis, lack of necessary diagnostic tools, inadequate examination, late identification of patients, objective difficulties in providing medical care. assistance, lack of necessary funds for assistance and treatment, shortcomings in the organization of medical and diagnostic work, insufficient qualifications of the doctor, inattentive attitude towards the patient, and other reasons. Medical records, medical reporting and statistical analysis of medical data are the main components of the information and statistical activities of a medical institution. Medical records are maintained in order to ensure the reliability, completeness, comparability, continuity and timeliness of obtaining medical information and include formalized documents of individual (personal) and collective records. Medical records are intended for uniform registration of medical data, ensuring continuity in the examination, treatment and dispensary dynamic observation of military personnel, have legal significance, can be used in the interests of insurance medicine, as well as in automated processing of medical information. LECTURE No. 1. Basic principles of medical care for the population Medical care for the population is a complex system both in terms of the types of preventive and curative services provided and the types of institutions. Types of medical and preventive institutions (HCI) of health care: 1) hospital institutions (city, children's, district, central district, regional hospital, city clinical hospital, city emergency hospital, medical unit); 2) specialized hospitals (psychiatric, tuberculosis, ophthalmology, infectious diseases, etc.); 3) dispensaries (anti-tuberculosis, oncological, cardiological, neuropsychiatric, narcological, medical and physical education, etc.); 4) outpatient clinics (city polyclinic, outpatient clinic, dental clinic, health centers, feldsher-obstetric stations); 5) institutions for the protection of motherhood and childhood (nursery, kindergarten, orphanage, dairy kitchen, maternity hospital); 6) emergency and emergency care and blood transfusion facilities (ambulance stations, blood transfusion stations); 7) sanatorium-and-spa institutions (sanatorium, sanatorium-dispensary, balneological and mud baths). In addition to this nomenclature, a typical categoricalness is also established depending on the capacity of the institution, which contributes to the rational planning of the network of institutions and states. Outpatient clinics are divided into five categories according to their capacity, depending on the number of medical visits per shift. The capacity of hospitals is determined by the number of beds. Treatment and preventive care for the population is divided into polyclinic and inpatient. 1. Activities of the polyclinic A polyclinic is a multidisciplinary medical and preventive institution that provides medical care to the population in the assigned territory at the pre-hospital stage. There are two types of polyclinics for the adult population in cities: 1) associated with hospitals; 2) non-united (independent). By capacity, city polyclinics are divided into 5 groups. The structure of the city polyclinic provides for the following units: 1) management of the clinic; 2) registry; 3) pre-medical reception room; 4) prevention department; 5) medical and preventive units: a) therapeutic departments; b) department of rehabilitation treatment; c) departments for the provision of specialized types of medical care (surgical, gynecological) with offices of relevant specialists (cardiological, rheumatological, neurological, urological, ophthalmological, otorhinolaryngological); 6) paraclinical services (physiotherapy and x-ray rooms, laboratories, functional diagnostics room, ultrasound room); 7) day hospital and hospital at home; 8) administrative and economic part; 9) medical and feldsher health centers at attached enterprises. The number of departments and offices, their potential capabilities are determined by the capacity of the polyclinic and the number of staff positions, which depend on the size of the population assigned to the polyclinic. The structure of the polyclinic (the opening of certain departments, offices, etc.) depends on the appeal of the population to this institution, on the ability of the polyclinic to provide patients with the necessary medical care. The main functions and tasks of the city polyclinic: 1) provision of qualified specialized medical care to the population directly in the clinic and at home; 2) provision of first aid in case of acute diseases, injuries, poisonings and other urgent conditions, regardless of the place of residence of the patient; 3) timely hospitalization of those in need of inpatient treatment; 4) examination of temporary incapacity for work, release of patients from work, referral for medical and social examination of persons with signs of permanent disability; 5) organization and implementation of a set of preventive measures aimed at reducing morbidity, disability and mortality among the population living in the service area, as well as among those working at attached enterprises; 6) organization and implementation of medical examination of the population (healthy and sick); 7) referral of patients to sanatorium treatment; 8) organizing and conducting activities for sanitary and hygienic education of the population, promotion of a healthy lifestyle. The work of the city polyclinic is based on the territorial-district principle. The territorial therapeutic area is the main structural unit of the polyclinic. Clinical examination is an active method of monitoring the state of health of the population and a system of scientifically based socio-economic, organizational, sanitary and health-improving, treatment-and-prophylactic and anti-epidemic measures aimed at maintaining and speeding up the restoration of health, reducing morbidity, labor and social rehabilitation. Doctors of any specialty carry out work to identify diseases at early, preclinical stages, carry out systematic (dynamic) monitoring, timely and high-quality treatment of patients, and prevent the occurrence and spread of diseases. For each specialty, a special list of patients subject to clinical examination is established. Preventive medical examinations of the population are carried out to detect diseases in the initial stages and to carry out the necessary treatment, preventive and health-improving measures. Preventive medical examination - an active medical examination of certain groups of the population by doctors of one or more specialties and the conduct of laboratory diagnostic studies for the purpose of early detection of diseases and the implementation of the necessary medical and recreational measures. In the registry for each patient, an "outpatient medical card" is entered, all other medical documents are recorded, stored and executed, and the workload on doctors is regulated through a coupon system or self-recording. Data on all received calls are entered in the "Doctor's House Call Record Book" (f. 031 / y). In the polyclinic, the district doctor works on a rotating schedule, sees patients in the polyclinic and provides home care: attends primary calls to the house and schedules active visits depending on the patient's health status. One of the most important sections of the work of a doctor in a polyclinic is the examination of working capacity. The medical institution maintains a special "Book of registration of disability certificates" (f. 036 / y). In unclear and conflict cases, as well as when referring to sanatorium treatment, the ITU and when deciding on a temporary transfer to another job, the patient is sent to the clinical expert commission (CEC). The clinic has a "Journal for recording the conclusions of the KEK" (f. 035 / y). In cases of chronic, protracted diseases, the patient is transferred to disability - temporary or permanent. The category (group) of disability is established by a medical and social examination, which is organized under the departments of social protection of the population. A day hospital in a hospital and a day hospital in a polyclinic are organized for patients who do not need round-the-clock medical supervision and treatment on the basis of multidisciplinary hospitals or outpatient clinics. The capacity of hospitals is determined individually in each case by the head doctor of the health facility, on the basis of which it is organized. Depending on the availability of conditions, a day hospital deployed in medical institutions can have from 6 to 20 or more beds. On each bed, patients for 2 - 4 - 6 hours with a break of 20 - 30 minutes are daily monitored by a doctor, laboratory diagnostic examinations, drug therapy, procedures and injections. In the centers of outpatient surgery, surgical interventions of increased complexity are performed. For a patient who is in a day hospital, a "Medical card of an inpatient patient" is entered with brief information from the anamnesis, the history of the disease and the examination and treatment being carried out. A hospital at home in outpatient clinics is organized for patients with acute and chronic diseases, whose condition does not require hospitalization. The states of a hospital at home are established in accordance with the staff standards provided for outpatient clinics. The selection of patients is carried out by the heads of therapeutic departments on the proposal of local general practitioners and medical specialists. If the condition worsens, the patient is transferred to the hospital. All records for a patient who is in a hospital at home are made in the "Medical record of an outpatient". Adjustment of treatment and extension of the sick leave are carried out with the involvement of the CEC at home within the time limits established by the legislation for the examination of temporary disability. The hospital at home uses in its work all the advisory and treatment and diagnostic services of the polyclinic. Inpatient medical care is provided for the most severe diseases that require an integrated approach to diagnosis and treatment, the use of complex instrumental methods of examination and treatment, surgical intervention, constant medical supervision and intensive care. The main and leading link in the system of inpatient medical care for the urban population is a modern city hospital, which is a complex multidisciplinary institution equipped with a variety of medical and diagnostic equipment and equipment, with paraclinical services, a pharmacy and administrative and utility rooms. 2. Hospitalization The polyclinic keeps a systematic record of patients in need of inpatient treatment in the "Registration Book of Patients Appointed for Hospitalization" (f. 034 / y). In addition, patients are delivered to the hospital "Ambulance" or in the order of transfer from other hospitals; in emergencies, patients may be admitted without a referral. In the admissions department, a "Medical record of an inpatient" (f. 003 / y) is entered for an admitted patient, in which the attending physician makes entries in the future. All admitted patients, as well as cases of hospitalization refusals, are recorded in the "Journal of admission of patients and hospitalization refusals" (f. 001 / y). The inpatient department is the main structural unit of the hospital. States of ward doctors are determined depending on the number of beds. A complete clinical examination of the patient should be carried out during the first 3 days of his stay in the hospital. The patient is subject to discharge with complete recovery or persistent improvement that does not require further hospitalization, and with the possibility of further treatment in the clinic. For each patient who has left the hospital, a special "Statistical card of the person who has left the hospital" (f. Obb / y) is filled out, on the basis of which the incidence of hospitalized patients is studied and the annual report of the hospital is compiled. In the event of the patient's death, a "Medical death certificate" (f. 106 / y) is issued. The corpses of patients who died in the hospital are necessarily subjected to a pathoanatomical autopsy in the presence of the attending physician and the head of the department. The autopsy data is recorded in the "Medical record of the inpatient". Paraclinical services include laboratories, treatment and diagnostic rooms (X-ray, physiotherapy, functional diagnostics, exercise therapy and massage, etc.), pathoanatomical department. 3. Medical care of the rural population Medical care for the rural population has specific forms and methods of organizing medical care. The main and distinctive feature of the system of organizing medical care for the rural population is its staging, in which medical and preventive care for the villagers is provided by a complex of medical institutions (from FAPs to the regional hospital). The essence of the principle of stages is that at each of the subsequent stages medical care is provided, which could not be provided at the previous stage. In accordance with this, each stage includes medical institutions, the functions of which are different. The main tasks and functions of the rural medical site: 1) outpatient and inpatient medical care to the population; 2) patronage of pregnant women; 3) measures to protect the health of children and adolescents; 4) sanitary and anti-epidemic measures; 5) study of morbidity at the site; 6) health education and organization of the work of a sanitary asset; 7) monitoring the sanitary condition of settlements and other facilities; 8) medical and sanitary support for field work; 9) preparation of a sanitary asset and sanitary and educational work. A feldsher-obstetric station (FAP) is organized when the rural population is 700-3000 people and the distance to the nearest medical facility is 2-4 km. At the FAP, therapeutic and preventive work is carried out: 1) for the provision of emergency pre-medical care on an outpatient basis and at home; 2) to identify and isolate patients with acutely contagious diseases; 3) for the prevention and reduction of morbidity, including infectious and parasitic; 4) on current sanitary supervision of children's preschool and school institutions, communal, food, industrial facilities, water supply; 5) organization of medical examinations of the population, selection of patients for dispensary observation, employment of patients; 6) control over the state of health of patients, accounting; 7) for the preparation and maintenance of accounting and reporting documentation on their activities. At the direction of the doctor, the paramedic conducts medical procedures and preventive vaccinations for the population of the site. Preventive examinations of pregnant women, patronage of newborns and puerperas are carried out. A district hospital is a medical facility that provides first aid. Its capacity is determined by the number of beds and depends on the radius of service, the number and density of the population, the presence of industrial enterprises. The nature and scope of inpatient care provided by district hospitals depend on its equipment and the availability of specialist doctors. In district hospitals beds are being deployed for general profile and for the main specialties (surgery, pediatrics, infectious diseases). In the outpatient department (outpatient clinic) of the district hospital, doctors receive adults and children, provide emergency care at home and, if necessary, hospitalize the patient in a hospital. Doctors, together with paramedics, conduct a medical examination of the population of the site, carry out an examination of working capacity, ensure continuity in the examination and treatment of patients with a hospital, an ambulance, specialized medical institutions, organize and conduct preventive examinations of the population, active patronage of women and children, and improve the sanitary culture of the population . A complex of sanitary and anti-epidemic measures is being carried out at the SVU under the guidance and control of the regional center for sanitary and epidemiological supervision, vaccinations are organized for the entire population (especially children). When infectious diseases are detected, early diagnosis and hospitalization of patients in the infectious diseases department of the district hospital are provided. The main institution of the second stage of medical care for the rural population is the central district hospital (CRH). It provides the rural population with qualified medical and preventive care, both inpatient and outpatient. The main tasks of the CRH: 1) providing the population of the district and the district center with highly qualified, specialized inpatient and outpatient medical care; 2) operational and organizational and methodological guidance and control over the activities of all health care institutions of the district; 3) planning, financing and organization of material and technical supply of medical institutions of the district; 4) development and implementation of measures aimed at improving the quality of medical care for the rural population; 5) introduction of modern methods and means of prevention, diagnosis and treatment into the practice of the work of the health care facility of the district; 6) carrying out activities for the placement, rational use and professional development of personnel. The CRH, regardless of the bed capacity, population and service radius, has a hospital, a polyclinic, a pharmacy, a dissecting office, paraclinical and administrative services, an organizational and methodological office, an ambulance and emergency department. At least 5 departments in such specialties as therapy, surgery, pediatrics, obstetrics and gynecology, and infectious diseases should be organized in the CRH hospital. In addition to the required minimum, large CRHs may have departments in other specialties (neurology, otorhinolaryngology, ophthalmology, traumatology, etc.). In the polyclinic department of the Central District Hospital, specialized care is provided in 10 to 15 specialties, and such departments often function as inter-district specialized centers. A large place in the work of the Central District Hospital is occupied by mobile assistance. Mobile medical teams are formed by the chief physician and receive patients in 5-7 specialties. Ambulance and emergency care is carried out by the relevant department, which is part of the Central District Hospital, which is responsible for providing this type of assistance to the population of the district center and the settlements assigned to it. One of the most important structural subdivisions of the CRH is the organizational and methodological cabinet (OMC), headed by the deputy chief physician of the CRH for medical care of the population of the district. The main tasks of the OMK, which is the main assistant to the chief physician in matters of management, organization and coordination of the entire organizational and methodological work of the Central District Hospital and other medical institutions of the district, include: 1) analysis and generalization of data on the state of health of the population and the activities of the health care facilities of the district; 2) calculation of estimated indicators and analysis of the activities of the Central District Hospital as a whole and for individual specialized services; 3) drawing up a summary report on the network, personnel and activities of the health care facility of the district; 4) identification of shortcomings in the work of health care facilities and development of measures to eliminate them; 5) development of an action plan for medical care for the entire population of the district, control over its implementation. The OMK work plan is actually a plan for the organizational and methodological work of the entire CRH. Its mandatory sections are: 1) analysis of demographic indicators and reporting materials on the network, personnel and activities of healthcare facilities in the district and on the state of public health; 2) organization and implementation of measures to provide medical advisory and organizational and methodological assistance to medical institutions of the district; 3) carrying out activities to improve the skills of medical workers; 4) strengthening the material and technical base of the health care facilities of the district. The main (district) specialists of the district, who are also heads of specialized departments of the Central District Hospital. Each district hospital should have at least a therapeutic, surgical, maternity, infectious diseases department and separate wards for children, for patients with tuberculosis; in the same specialties, admission is carried out at the polyclinic. Regional medical institutions (OMU) - the third stage of providing highly qualified (including highly specialized) medical care to the rural population - include the following institutions: 1) a regional hospital with a consultative polyclinic; 2) regional specialized centers; 3) regional dispensaries and specialized hospitals; 4) regional center for sanitary and epidemiological supervision; 5) clinics of medical institutes, research institutes and other medical institutions of the regional center. The main medical institution is the regional hospital. This is a large multidisciplinary institution that provides not only qualified consulting inpatient and outpatient care, but is also an organizational and methodological center, a base for specialization and advanced training of doctors, and a clinical base for medical institutes. The main tasks of the regional hospital are: 1) providing the population of the region with highly qualified specialized advisory, outpatient and inpatient care; 2) provision of emergency and planned advisory medical care by means of air ambulance and ground transport with the involvement of specialists from various institutions; 3) providing organizational and methodological assistance to the health care facilities of the region in improving the medical care of the population; 4) management and control over statistical accounting and reporting of health care facilities of the region. The regional hospital has a consultative polyclinic and a hospital with specialized and highly specialized departments, an emergency and planned medical care department, an organizational and methodological department, a dissecting department, an administrative and economic part and paraclinical services, the number and set of which are much wider than in the Central District Hospital. The most important element of the regional hospital is the advisory polyclinic, whose specialists establish or clarify the diagnosis of patients referred from the regional hospitals, decide on their further treatment and, in particular, on the need for hospitalization. For each patient, the advisory polyclinic gives a medical report, which indicates the diagnosis, treatment and further recommendations. The advisory polyclinic develops proposals on the procedure and indications for referral of patients from the health care facility of the region, analyzes cases of discrepancies between the diagnoses established by the institution that referred the patient for a consultation and the advisory polyclinic, as well as mistakes made by the doctors of the health facility during the examination and treatment of patients before referring them to the advisory polyclinic . Based on this analysis, a quarterly assessment of the state and level of medical and diagnostic work in the districts of the region is carried out. The hospital of the regional hospital, as in the Central District Hospital, includes departments for the main clinical specialties (therapy, surgery, pediatrics, obstetrics and gynecology, etc.), as well as highly specialized departments - urological, endocrinological, neurosurgical, etc. In the surgical departments, treatment of emergency and planned patients. The regional hospital provides scheduled visits, emergency and urgent specialized medical care to rural residents in any locality of the region. For this, the regional hospital has a special department with a round-the-clock dispatch service for receiving and registering urgent calls from the regions of the region, equipped with ground transport and air ambulances. Air ambulances are also used to transport patients from remote areas in the event that they cannot be provided with the necessary assistance on the spot. In the structure of the regional hospital, an important place is occupied by the organizational and methodological department (OMO), which, together with specialists, analyzes the activities of district and district hospitals based on annual reports and materials from examinations and field trips of doctors. In addition, OMO studies and disseminates the experience of these institutions, forms and methods of their work, studies the regional pathology and morbidity of the population of the region. On the basis of the received data, OMO develops proposals and measures to improve the quality of medical care, organizes statistical accounting and reporting in all health facilities of the region, trains staff on these issues and carries out statistical audits. The most important functions of the regional hospital are also the training of medical specialists and the advanced training of doctors. For this purpose, primary specialization of young doctors, as well as ten days, meetings, seminars on the latest methods and means of diagnosing, treating and preventing various diseases are held on the basis of the regional hospital. Only the combined efforts of all three links of medical institutions - the district, district and region - make it possible to provide medical care to the rural population at a high level. LECTURE No. 2. Population health statistics Methods for studying public health Medicine is based on two fundamental concepts - "health" and "disease". All theoretical and practical problems of health care are connected with these main categories, since any medical activity is aimed primarily at maintaining and strengthening people's health, preventing and treating diseases. In modern literature, there are many different interpretations of the concept of "health", which are classified as follows: 1) health as the absence of disease; 2) health and norm as identical concepts; 3) health as a unity of morphological, psycho-emotional and socio-economic concepts. For these definitions, the concept of health as something opposite to illness is common. Human health cannot be reduced only to a statement of the absence of disease, malaise, discomfort. According to the WHO, "health is a state of complete physical, mental and social well-being and not merely the absence of disease or infirmity". There is also a so-called third (or intermediate) state, which is close either to health or to a disease, but is neither one nor the other. It includes: neurasthenia, loss of appetite, irritability, headache, fatigue, etc. It is typical for people who smoke, drink alcohol, move from one time zone to another, as well as people during puberty and the extinction of sexual function, for women in the prenatal and postnatal periods and in old age, when there is a decline in the vital activity of the body. The third state reduces the potential capabilities of a person, does not give him the opportunity to use all the mental and physical capabilities inherent in him by nature. It contains the origins of many diseases, so the ability to diagnose this condition, prevent and eliminate it is the most important task of medical science and practical healthcare. The health and illnesses of an individual are basically expressed by biological criteria of adaptation, variability, and heredity. In humans, general biological qualities are not fundamental, they are mediated by the social conditions of his life. That is why one should talk about people's health and illnesses and approach a person not only as a biological organism, but also as a social being, i.e., treat "health" and "disease" as biosocial categories. It is impossible to understand and define health in isolation from the specific environment in which a person lives, therefore, a competent definition of health is possible only on the basis of understanding the essence of a person, the problem of the relationship between social and biological. Human health is researched and measured at various levels. If we are talking about individuals, they talk about individual health, if about their communities - about group health, if about the health of the population living in a certain territory - about the health of the population. When assessing the state of health, each level requires its own approaches. Individual health is assessed by personal well-being, the presence or absence of diseases, disability, physical condition and development, etc. When assessing group health, special criteria are used. The health of the population is also studied at the sociological level, that is, at the level of public health. Public health reflects the health of the individuals that make up society. This is not only a medical concept, but to a large extent a social, socio-political and economic category, since the external social and natural environment is mediated through specific living conditions - work and life. There are three groups of indicators by which the state of health of the population is judged, these are: 1) demographic indicators; 2) indicators of morbidity and disability; 3) indicators of physical development. Most of the health indicators qualify the presence and prevalence of diseases, accidents, deaths, permanent disability, defects and retardation in mental and physical development, since medicine is characterized by focusing on pathological conditions, i.e., the definition of health through the nature and intensity diseases. The concept of health is closely related to ideas about risk factors - conditions that contribute to the emergence and development of diseases. The main determinants of health include: 1) environmental factors - the climate of a given territory, relief, flora and fauna of the area, solar radiation, average annual temperature, a complex of cosmic factors; 2) biological and psychological factors that characterize the individuality of a person: heredity, adaptive properties of the body, temperament, constitution, behavior, that is, what characterizes the individuality of a person; 3) socio-economic factors - socio-economic and political development of society, living conditions, work, life, etc.; 4) medical factors - the state of healthcare, the development of medical and sanitary services, defects and shortcomings in the organization of medical care, medical activity of the population. A person receives a combined effect of interrelated and mutually determining factors, therefore a comprehensive medical and social study of the state of health of the population is carried out taking into account the influence of a larger number of factors, their relationship and the rank assessment of each of them. There are primary risk factors that depend on socio-economic, political, natural conditions, and secondary risk factors that contribute to the emergence of pathological conditions and the development of diseases. Therefore, along with indicators generally accepted for characterizing health, indicators that allow assessing the functional state of the body according to various physiological and biochemical changes that do not yet cause disease, but reduce the adaptive capabilities of the body and are combined into the concept of premorbid states, are of great importance. The most adequate criterion of public health is the category of lifestyle, and the indicator is the medical and social potential of working capacity. Public health research, especially the health of the healthy, is of strategic importance in preventing disease and improving the health of the population. Currently, there is a negative trend towards an increase in the number of patients and persons with risk factors against the background of a relatively small proportion of healthy people. This makes it especially relevant to study the state of public health and solve the problems of primary prevention of diseases and various pathological conditions. Demography Demography is the science of population, the term comes from the Greek demos - "people" and grapho - "description". The task of demography is to study the territorial distribution of the population, trends and processes occurring in the life of the population in connection with socio-economic conditions, life, traditions, environmental, medical, legal and other factors. Medical demography studies the relationship between population reproduction and social and hygienic factors and develops medical and social measures aimed at ensuring the most favorable development of demographic processes and improving the health of the population. The statistical study of the population is carried out in two main directions: 1) population statics; 2) population dynamics. Population statistics are data on the population size, population composition by sex, age, social status, profession, marital status, cultural level, population location and density. Accounting for the size and composition of the population is carried out by periodically conducted population censuses - every 10 years. Between censuses, the population is recorded by registering births and deaths, as well as registering the population by place of residence. In the production of the census, two categories of the population are distinguished: cash and permanent. Cash (or actual) is the population that is at the time of the census in this locality, regardless of how long this or that person lives in it and whether or not he intends to stay there in the future. A permanent population is a population permanently living in a given locality, regardless of whether it is present or temporarily absent at the time of the census. The resident population is determined by adding those temporarily absent to the actual population and excluding those temporarily arriving at the time of the census. In health care, in order to determine the indicators of fertility, mortality, morbidity, and others, it is necessary to know the number of both the permanent and the present population. An indicator of the spatial distribution of the population is the population density per 1 km2. This important factor is taken into account when deciding on health planning issues. The distribution of the population by sex and age is necessary to determine the prospects for population growth, the reproduction of labor resources, and the analysis of data on morbidity and mortality. From a socio-economic point of view, it is of great interest to distinguish three main age groups in the composition of the population (according to the participation of the population in the labor process): 1) younger than working age (0 - 15 years); 2) working age (men - 16 - 59, women - 16 - 54 years); 3) older than working age (men - 60 years and older, women - 55 years and older). At the same time, when determining the type of age structure of the population, the proportion of people aged 0 to 14 years, 15 to 49 years, 50 years and older is taken into account in its composition (Table 1). A progressive population is one in which the proportion of children aged 0-14 exceeds the proportion of the population aged 50 and over. The regressive type is considered to be the population in which the proportion of people aged 50 years and older exceeds the proportion of the child population. Stationary is the type in which the proportion of children is equal to the proportion of persons aged 50 years and older. The progressive type of population provides a further increase in the population, the regressive type threatens the nation with extinction, with the stationary type, natural population growth occurs very slowly or is at a stationary (unchanging) level. Table 1 Age structure of the population corresponding to three types  A statistical indicator of aging is the proportion of people aged 60 years and older (Table 2). feature of the XNUMXth century. is the process of "aging" of the population. Table 2 Classifications of societies depending on the degree of development of the process of population aging  The process of population aging affects the processes of population reproduction, the nature of pathology and the prevalence of chronic diseases, and the level of the population's need for social assistance. In Russia, a pronounced process of population aging is currently taking place - demographic old age (Table 3). Table 3 Characteristics of the composition of the population of Russia (according to the 1989 census)  Population dynamics is the movement and change in the size and composition of the population, which can occur as a result of mechanical movement - under the influence of migration processes, social movement associated with the transition from one social group to another, and the natural movement of the population as a result of births and deaths. The mechanical movement of the population occurs as a result of migration processes. Distinguish between internal and external migration, according to duration - temporary, permanent, as well as seasonal and pendulum. According to the nature, planned and spontaneous migrations are distinguished. Migration has a significant impact on the total population and its composition, indicators of population reproduction. When evaluating migration processes, indicators such as: 1) turnover of migration processes; 2) balance of migration; 3) intensity of migration, etc. The turnover of migration processes is the sum of arrivals and departures. The balance of migration (Δ) is defined as the difference between the number of arrivals M + and departed M - and can be positive and negative: Δ = M+-M-. The overall intensity of migration (β) is the ratio of the number of migrating persons to the population of a given territory (S): β = ∆/S x 1000. Accordingly, the intensity of migration of arrivals β+ and departures β - is determined: β+ = M+ / S x 1000; β- = M- / S x 1000. Similarly, the age-sex intensity of migration of arrivals and departures is calculated. Migration efficiency ratio: migration gain (balance) / sum of arrivals and departures x 1000. According to the 1989 census, the number of arrivals per 1000 (intensity of arrivals) was 42, departures - 35, the net migration (migration gain) is 7. In recent years, migration processes have been largely influenced by socio-economic upheavals in society. The natural movement of the population is estimated by sanitary and demographic indicators. The main indicators are indicators of fertility, mortality, natural population growth, infant mortality, average life expectancy, and maternal mortality. Specifying indicators of the natural movement of the population are: fertility, mortality of children under 5 years of age, perinatal mortality, maternal mortality. Fertility is the process of renewal of new generations, which is based on biological factors that affect the body's ability to reproduce offspring. Birth registration is based on the registration of those born in obstetric institutions by filling in the "Medical Birth Certificate" (f. 103 / y). used to characterize the birth rate. total fertility rate: total number of live births per year x 1000 / average annual population. The average annual population is equal to half the sum of the population at the beginning and end of the year (population on 1.01 + 31.12 and divided by 2). The general birth rate gives only an approximate idea of the process of population reproduction, since it is calculated in relation to the size of the entire population. More accurate fertility characteristics are obtained by calculating special indicators (such as the indicator of general fertility, marital fertility, etc.). When calculating fertility (fertility) indicators, the calculation is carried out for women of childbearing (fertile) age - from 15 to 40 years. This age interval is called the generative, or fertile, period of a woman. Total fertility rate (fertility): total number of live births per year x 1000 / average number of women aged 15-49. This rate depends on the proportion of women of childbearing age in the total population and is usually 4 to 5 times the total birth rate. Marriage fertility rate (fertility): total number of live births per year to married women x 1000 / average number of women aged 15-49 who are married. In addition, the birth rate is specified by age-specific fertility indicators, for which the entire generative period of a woman is conventionally divided into intervals (15-19, 20-24, 25-29, 30-34, 35-39, 40-44, 45-49 years) . Age-specific fertility rates: number of live births to women of the corresponding age x 1000 / average number of women of the corresponding age. In fertility statistics, the total fertility rate is calculated, which shows the number of children born on average to one woman during the entire fertile period of her life. The indicator is calculated as the sum of age-specific fertility indicators calculated for one-year age intervals (Table 4). Table 4 Age indicators of fertility by age intervals  The numbers for the entire age interval are obtained by multiplying the age-specific indicator by the value of the age interval (5). The sum of the numbers in column three shows the number of children born per 1000 women for the entire fertile period; therefore, there are on average 2732,5/1000 = 2,73 children per woman. Gross ratio - the number of girls born on average to one woman during the entire fertile period of life. To calculate it, the total fertility rate is multiplied by the percentage of girls born in a given year. So, if the percentage of girls from all births is 49 (or 0,49), then the gross coefficient is: 2,73 x 0,49 = 1,33. Theoretically, the maximum value of the gross coefficient is 4,9; if it is more than 2, then this indicates the absence of a conscious birth control on a large scale. Of certain importance is the net coefficient - the net reproduction rate of the female population, showing how many girls born to one woman throughout her life, on average, would have survived to the age of the mother at the time of their birth, provided that the fertility and mortality levels of this period are maintained at each age . The indicator gives a generalized description of fertility and mortality in a given period of time. The birth rate in Russia tends to decrease, having reached catastrophic limits at the present time. To assess the social, demographic and medical well-being of a particular territory, it is necessary to take into account not only birth rates, but also mortality rates, since the interaction between them ensures continuous reproduction of the population. In the analysis of mortality, a number of indicators with different cognitive significance are used. Total mortality rate: total number of deaths per year x 1000 / average annual population. However, the overall mortality rate is hardly suitable for any comparison, since its value largely depends on the characteristics of the age composition of the population. Thus, the increase in the overall mortality rate in recent years in some economically developed countries does not so much indicate an actual increase in mortality as it reflects an increase in the proportion of elderly people in the age structure of the population. A more complete description of mortality is given by special indicators. Mortality rates of individual age and sex groups: number of persons of a given sex and age who died per year x 1000 / number of persons of a given age and sex. When studying the causes of death, the structure of the causes of death and the mortality rate by cause are calculated. Mortality from this disease (intensive indicator): the number of deaths from this disease per year x 1000 / average annual population. Structure of causes of death (extensive indicator): number of deaths from a given cause x 1000 / total number of deaths. The level and structure of mortality are due to the complex interaction of many factors, among which socio-economic ones play a significant role. in Russia since the early 1990s. there is a significant rise in the overall mortality rate, which is explained by the aging of the population and the socio-economic conditions in the country. In the structure of causes of death, diseases of the circulatory system, malignant neoplasms, accidents, injuries and poisonings occupy a leading place. The development of materials on the mortality of the population by cause is based on the data of the "Medical death certificate" (f. 106 / y), "Medical certificate of death" (f. 106-1 / y), "Medical certificate of perinatal death" (f. 106-2/y). Completion of death certificates and selection of the original cause of death are made in accordance with existing rules. Natural population growth serves as a generalizing characteristic of population growth. Natural increase can be expressed as an absolute number as the difference between the number of births and the number of deaths in a year. Moreover, it can be calculated as the difference between birth and death rates. A high natural increase can be considered as a positive phenomenon only if the mortality rate is low. High growth with high mortality characterizes the unfavorable situation with the reproduction of the population, despite the relatively high birth rate. Low growth with high mortality indicates an unfavorable demographic situation. Low growth with low mortality indicates a low birth rate. Negative natural growth (natural population decline) indicates trouble in society, which is typical for a period of war, economic crises and other upheavals. In Russia, since 1992, a negative natural population growth has been recorded, which is associated with the negative influence of three main factors, such as: 1) continuation in our country of the global global process of the demographic transition to a small family; 2) change in the age composition of the population - at present, a small contingent of women has entered the age group of the highest fertility (20 - 29 years); 3) the crisis state of the socio-economic sphere. In addition, the difficult socio-economic conditions, the ecological situation led to a significant deterioration in the health of the population. To assess public health, an indicator of the average life expectancy is used, which shows how many years on average a given generation of those born will live, if throughout the life of this generation the mortality rates remain the same as they are at the moment, and is calculated on the basis of age-specific indicators. mortality by constructing mortality tables. Infant mortality characterizes the death of newborn children from birth to the age of one year. It stands out from the general problem of population mortality due to its special social significance. Its level is used to assess the health of the population as a whole, social well-being, and the quality of medical and preventive care for women and children. Documents for registration of infant mortality are "Medical death certificate" (f. 106/y) and "Medical certificate of perinatal death" (f. 106-2/y). Analysis of infant mortality includes: 1) infant mortality for a calendar year; 2) infant mortality by months of a calendar year; 3) infant mortality by periods of the first year of life; 4) indicators of infant mortality from a given cause. The death rate for a calendar year is a total, general indicator with a stable birth rate for two adjacent years. Infant mortality rate equals: number of children who died before the age of 1 in a given year x 1000 / number of live births in a given calendar year. Since among the dead children there may be those born both in the given and in the previous calendar year, and the number of children born, as a rule, is not the same, there are formulas for a more accurate calculation of infant mortality. In practical health care, the WHO recommendation is used to calculate infant mortality. RATS formula: number of children who died during the year in the 1st year of life x 1000 / 2/3 live births in this year + 1/3 live births last year. For the purpose of operational monitoring of infant mortality, for the analysis of seasonal fluctuations, indicators are calculated for a certain calendar month. The indicator of infant mortality is specified by its analysis by periods of the first year of life. The level and causes of infant mortality are not the same in different periods of life. The death of children in the first year of life is distributed unevenly over different age periods. The maximum indicators of deaths were noted on the first day after birth, but subsequently, at first sharply, and then more gradually, there is a decrease with each passing day, week and month. The death of children during the first week was registered in 80% cases of death of children in the first month, death in the first month - about 70% of all infant mortality. According to the periods of the first year of life, the following indicators of infant mortality are distinguished: 1) early neonatal mortality (death of children in the first week of life): number of children who died at the age of 0 - 6 days (168 h) x 1000 / number of live births; 2) neonatal mortality (death of children in the first month of life): number of children who died before the age of one month (0 - 27 days) x 1000 / number of live births; 3) late neonatal mortality (death from the 7th to the 27th day of life): number of children who died in the 2nd, 3rd, 4th weeks of life x 1000 / number of live births - the number of deaths during the first week; 4) postneonatal mortality (death of children over the age of one month before they reach one year of age): the number of children who died over the age of one month x 1000 / the number of births - the number of deaths in the first month. To develop measures to reduce infant mortality, an analysis of infant mortality by causes is carried out. Infant mortality rate from this cause: the number of deaths under the age of one year from this cause x 1000 / 2/3 live births in this year + 1/3 live births last year. In assessing the health of children in the first year, the indicator of perinatal mortality is important. The perinatal period begins at 22 weeks of fetal development, includes the period of childbirth and ends after 7 full days of the newborn's life. The perinatal period includes 3 periods: 1) antenatal (from 22 weeks of pregnancy to delivery); 2) intrapartum (period of childbirth); 3) postnatal (the first 168 hours of life), which corresponds to the early neonatal period. The predominance of death in any of the periods indicates to a certain extent the level of medical care, the quality of preventive measures during pregnancy, childbirth, in the first week of life. Perinatal mortality rate: the number of stillborns + the number of deaths in the first 168 hours of life x 1000 / the number of live and dead births. Antenatal and intranatal mortality add up to stillbirth. According to the WHO definition, stillbirth includes all cases of death of a fetus and a newborn weighing 500 g or more (or, if birth weight is unknown, a body length of 25 cm or more, or a gestational age of 22 weeks or more). Despite the fact that this definition was officially adopted in Russia in 1993, the number of fetuses and newborns with a body weight of 1000 g or more (or, if birth weight is unknown, a body length of 35 cm) is still taken into account when calculating the perinatal mortality rate. or more, or gestational age of 28 weeks or more). Stillbirth rate: number of stillbirths x 1000 / number of live births and stillbirths. Infant mortality by months of the calendar year: the number of deaths under the age of 1 year in a given calendar month x 1000 / average monthly number of births. The average monthly number of births = the number of births in a given calendar month + the number of births in the previous 12 months, divided by 13 (Table 5). Table 5 Example of calculating monthly fluctuations in infant mortality
For January 2000, the number of births in 13 months is equal to the sum of those born in 1999 plus the number of births in January: 9642 + 778 = 10, etc. 10/420 = 13. The infant mortality rate per 1000 births in January is: 23 x 1000/801 = 28,7. When analyzing infant mortality, it must be remembered that the use of indicators by months of the calendar year is possible only at the regional level, since the study does not give reliable results in the region. In the structure of causes of infant mortality in Russia, the first place is occupied by diseases of the perinatal period (hypoxia, asphyxia, birth trauma, intrauterine infection), the second - by congenital malformations, the third place belongs to diseases of the respiratory system, the fourth - by infectious diseases (such as intestinal infections, sepsis and etc.). In international practice, in addition to infant mortality rates, it is customary to calculate the mortality rate for children under 5 years of age. This indicator was chosen by UNICEF as characterizing the situation of children in various states and as an indicator of the well-being of the child population. Under-5 mortality rate: number of children under 5 who die per year x 1000 / number of live births. In addition, to characterize the health of the population, the indicator is used mortality in children under 15 years of age. Maternal mortality is a demographic indicator that refines the overall mortality rate. According to the WHO definition, maternal mortality refers to the death of a woman due to pregnancy (regardless of its duration and location) and occurring during pregnancy or within 42 days after its termination from any cause associated with pregnancy, aggravated by it or its management, but not from an accident or an accidental cause. This indicator allows you to evaluate all losses of pregnant women (from abortions, ectopic pregnancy, obstetric and extragenital pathology during the entire gestation period), as well as women in labor and puerperas within 42 days after the end of pregnancy. Not included in the concept of "maternal mortality" are cases of death as a result of murder, suicide, poisoning, trauma and other violent causes. According to the WHO recommendation, the maternal mortality rate is calculated per 100 live births. Maternal mortality rate: the number of dead pregnant women (since the beginning of pregnancy), women in labor, puerperas within 42 days after the termination of pregnancy x 100 / number of live births. The maternal mortality rate should be calculated at the level of district, city, region, territory, republic. In the institution where the death occurred, a detailed analysis of each case (without calculating the indicator) of death from the standpoint of its preventability should be carried out. When assessing the dynamics of maternal mortality in areas with low fertility, in order to avoid errors, statistical methods should be used, in particular, the alignment of the dynamic series using the moving average method, which makes it possible to replace each level of the series with an average value from a given level and two neighboring ones, to eliminate the influence random fluctuations to the level of the dynamic series and helps to identify the main trend. An analysis of the structure of the causes of maternal mortality makes it possible to establish the place of one or another cause among all the dead women. Structure of causes of maternal death (extensive indicator): number of women who died from a given cause x 1000 / total number of women who died from all causes. Of essential importance in the analysis of maternal mortality is the calculation of the frequency of death from individual causes. Maternal mortality from individual causes: number of women who died from a given cause x 100 / number of live births. In the structure of the causes of maternal death, a large part (80%) is occupied by obstetric causes, and approximately 20% are occupied by causes associated with pregnancy and childbirth only indirectly (in particular, extragenital diseases). Among obstetric causes, 70% belong to complications of pregnancy and childbirth, 25% to the consequences of abortion and 5% to ectopic pregnancy. Among extragenital diseases, diseases of the cardiovascular system predominate. The high level of maternal mortality in the country is due to a number of reasons. In recent years, there has been an ever-increasing deterioration in the health of pregnant women, the rate of early coverage of their medical supervision, the quality of medical examinations of pregnant women are declining, and there is a high prevalence of abortions. One of the causes of maternal mortality is the insufficient qualification of obstetrician-gynecologists. Physical development Physical development is one of the objective indicators of the state of health of the population, which is currently changing as sharply as other indicators (morbidity, mortality, infant mortality, average life expectancy, etc.). The methods of statistical accounting and analysis of data on the physical development of the population have received a deep scientific justification and are widely used in the practical research activities of healthcare institutions. Physical development is understood as a complex of morphological and functional properties of the body, characterizing the size, shape, structural and mechanical qualities and the harmony of the development of the human body, as well as the reserve of its physical strength. Monitoring the physical development of the population in Russia is an obligatory part of the state system of medical health control. It is systematic and applies to different age and sex groups of the population. The foundations of physical development are laid in childhood, so the indicators that characterize it are mandatory when assessing the health of the younger generation. Physical development is usually studied in newborns, children of various age groups and adolescents, as well as in the adult population to characterize generations of different years of birth. There are differences in the physical development of the population living in different economic and geographical zones, people of different nationalities. Under the influence of long-term adverse factors, the level of physical development decreases, and vice versa, the improvement of conditions, the normalization of lifestyle contribute to an increase in the level of physical development. There are three groups of main factors that determine the direction and degree of physical development: 1) endogenous factors (heredity, intrauterine effects, prematurity, birth defects, etc.); 2) natural and climatic factors (climate, terrain, the presence of rivers, seas, mountains, forests, etc.); 3) socio-economic factors (social system, degree of economic development, working conditions, life, nutrition, recreation, cultural and educational level, hygiene skills, upbringing, etc.). All these factors operate in unity and interdependence, however, since physical development is an indicator of the growth and formation of the organism, it is subject not only to biological laws, but to a greater extent depends on a complex set of social conditions that are of decisive importance. The social environment in which a person is located forms and changes his health, including determining the level and dynamics of physical development. Thus, physical development is an integral indicator of the state of health, which is influenced by a variety of external and internal factors. In this regard, the main tasks of studying the physical development of the population are: 1) monitoring the level and changes in the physical development of various groups of the population; 2) in-depth study of the age-sex patterns of physical development in connection with the peculiarities of living conditions, work and life, the nature and forms of medical care, sports; 3) development of age-sex assessment norms-standards for the physical development of the population for various ethnic groups in different climatic zones and economic regions; 4) evaluation of the effectiveness of recreational activities. Observation and control over the physical development of a person begins from the moment the child is born: in the maternity hospital, the features of the physical development of newborns are specially studied. This work continues in children's polyclinics and preschool institutions. The physical development of schoolchildren and adolescents is subject to mandatory observation and medical control. School doctors, using the developed age-sex standards, can make a group and individual assessment of the level of physical development of schoolchildren and correct it as necessary by the methods of physical education. Observation of the physical development of the adult population is carried out in the pre-conscription period, during conscription for military service, during military service, as well as during one-time periodic in-depth medical examinations of various groups of workers, employees, students, athletes, etc. Data on physical development is always collected in the process of specially organized research, on the basis of anthropometric measurements carried out according to a strictly unified program. Anthropometric measurements should be carried out in relation to certain groups of the population in the following order: 1) newborns are measured in maternity hospitals at birth and discharge; 2) children of the first year of life and aged 1 to 3 years - in nurseries and children's clinics on a monthly basis; 3) children from 3 to 7 years old - in kindergartens and children's clinics 2 times a year; 4) children and adolescents (schoolchildren) from 7 to 18 years old - in schools 1 - 2 times a year; 5) pupils and students of vocational schools, secondary specialized and higher educational institutions - at the place of study during medical examinations once a year; 6) pre-conscripts - in the military registration and enlistment offices at the place of residence; 7) working youth - in medical units of enterprises during medical examinations; 8) military personnel - in first-aid posts at the place of service during in-depth medical examinations 1-2 times a year; 9) athletes - in medical and sanitary institutions of sports societies and medical and physical education dispensaries in the prescribed manner. Since physical development depends on age and sex, indicators are calculated for homogeneous age and sex groups in each observation area. Due to the fact that the rate of change in indicators of physical development is not the same in different periods of a child's life, the grouping of material for different age periods is carried out with different time "steps": 1) for children of the first year of life - by months; 2) for children from 1 to 3 years old - every 3 months; 3) for children from 3 to 7 years old - every six months; 4) for children over 7 years old - for each year. There are basic signs of physical development, usually recorded in the process of conducting mass medical examinations of the population. These include the following. 1. Anthropometric, based on measuring the dimensions of the human body and skeleton, including: 1) somatometric - the dimensions of the body and its parts; 2) osteometric - the dimensions of the skeleton and its parts; 3) craniometric - the dimensions of the skull. 2. Anthroscopic, based on the description of the body as a whole and its individual parts. These include: 1) body type; 2) development of the fat layer, muscles; 3) the shape of the chest, back, abdomen, legs; 4) pigmentation; 5) hairline; 6) secondary sexual characteristics, etc. 3. Physiometric, determined with the help of special physical instruments. These include: 1) vital capacity of the lungs (measured with a spirometer); 2) muscle strength of the hands (measured by a dynamometer), etc. Thus, the main signs of physical development are the length and weight of the body, expressing fatness, the development of the bone skeleton and muscles. In addition, they include the circumference of the chest during inhalation and exhalation, which characterizes its capacity and the development of the respiratory organs. Sitting height is also measured, characterizing the proportionality of the body; in newborns, head circumference is measured. With dynamic observation, the growth of these indicators over a certain time (for example, for a year) is estimated. For a comprehensive characterization of physical development, in addition, the features of morphological maturation are studied (change of milk teeth to permanent ones, the degree of severity of secondary sexual characteristics, the age of menarche, etc.). The data of anthropometric measurements are processed by the method of variation statistics, as a result of which the average values of height, weight, chest circumference are obtained, used in the individual and group assessment of physical development. Assessment of physical development is of great importance for many areas of medicine. Indicators of physical development are used to calculate anthropometric risk markers for a number of diseases and pathological conditions. In obstetrics, the measurement of a woman's pelvis allows you to determine the tactics of childbirth. Anthropometric indicators are used to monitor the physical development of children and adolescents, to assess the effectiveness of ongoing recreational activities, they are necessary to determine the daily routine and physical activity of the child. Along with the study of anthropometry data, special attention is paid to assessing the level of biological development, i.e., biological age. The slow rate of biological development is essential for resolving the issue of a child's readiness for schooling due to the fact that a significant proportion of these children experience serious difficulties at school, especially in the lower grades. In addition, the assessment of biological age is used to determine the child's athletic abilities, as well as in forensic practice. In clinical practice, a number of anthropometric indicators are important criteria for defining such concepts as "live birth", "stillbirth", "prematurity", "birth weight", etc. In hygiene, indicators of physical development are necessary for the standardization of clothing, footwear, furniture, and the rational arrangement of workplaces. In military medicine, indicators of physical development help determine fitness for military service and the type of troops. A comprehensive assessment of physical development, taking into account both the level of biological development and the morphofunctional state of the body, makes it possible to identify both children with harmonic physical development corresponding to their age, and children with various deviations due to excess or deficiency of body weight. Physical development is of great medical and social importance. Its level says a lot about the social well-being of society. Disorders of physical development may indicate unfavorable conditions and lifestyle of the child and are one of the criteria for determining the level of social risk of a family, identifying socially disadvantaged families that require measures of medical and social impact. Methods for studying physical development To obtain accurate results in the assessment of physical development, it is necessary to comply with a number of standard conditions, namely: the assessment should be carried out in the morning, with optimal lighting, the presence of serviceable instruments, using a unified measurement methodology and technique. Anthropometry is carried out using special tools: an anthropometer, stadiometer, centimeter tape, compasses, calipers, etc. Physiometry is carried out on special devices. In addition, photography can be used to assess physical development (the so-called stereophotogrammetry method). Observation of the physical development of children begins from the moment of birth. According to WHO, birth weight is the result of the first weighing of the fetus or newborn, recorded after birth. This weight should preferably be established within the first hour of life, before significant postnatal weight loss occurs. Measurement of the length of the body of a newborn or fetus must be carried out with its extended position on a horizontal stadiometer. Newborns (fetuses) born weighing up to 2500 g are considered low birth weight fetuses, up to 1500 g - very low, up to 1000 g - extremely low. In the future, regular assessment of the physical development of children continues in the children's clinic, preschool institutions, and schools within the time limits established by special orders. The results of the assessment are entered in the "History of the development of the newborn" (f. 097 / y), "History of the development of the child" (f. 112 / y), "Medical record of the child" (f. 025 / y). To study, analyze and evaluate physical development, two main methods of observation are used: 1) generalizing method (population cross-sectional method) - based on a one-time measurement of children of different ages, i.e. each child is measured 1 time at any age. Each age group must consist of at least 100 people. This method is very common. It reflects the level of physical development of children at a certain moment and is based on a large number of observations. It is the most representative for determining the level of physical development of the general population; 2) individualizing method (longitudinal section) - based on the measurement of the same children during the period of their growth and development. The same group of children is observed over a certain period (for example, a year of life), making it possible to obtain sufficient saturation of each age-sex group by months or years of life with a relatively small number of observations. This technique allows you to determine the features of the physical formation of the body from month to month (or from year to year) of the observed group of children in a homogeneous population. This method is of particular importance in connection with the process of acceleration, as well as for the standardization of school and preschool equipment, the construction of type-height scales, for the clothing and footwear industries. This method does not contradict the generalizing method and is an essential addition to it both in studying the process of the child's general development and in clarifying the influence of environmental factors in the course of this development. To obtain average indicators of physical development, a survey of large groups of practically healthy people of various ages and sexes is carried out. The obtained average values are the standards of physical development of the corresponding groups of the population. In order for the received data to be accepted as a standard, they must meet the following requirements: 1) be regional; 2) be developed on a sufficiently large group (at least 100 children); 3) all cases of heterogeneity should be excluded from the observation group (sick children from different populations with "popping up" data, suffering from rickets, endocrine diseases, with deviations in posture); 4) a generally accepted unified methodology for surveying, measuring, processing and analyzing data should be applied. There are no generally accepted standards of physical development. Different living conditions in different climatic and geographical zones, in cities and rural areas, ethnographic differences cause different levels of physical development of the population. In accordance with this, local and regional standards of physical development are determined. Local standards should be updated after about 5 years due to constantly changing conditions and lifestyles. An individual assessment of physical development is carried out by comparing anthropometric data with standards developed using various statistical methods, and determining the degree of their deviation from average values. Technique of variation-statistical development of anthropometric data. Derivation of standards of physical development The numerical data of individual signs obtained during anthropometric surveys (height, weight, chest circumference, etc.) are processed by the method of variation statistics to obtain average indicators - standards of physical development. First of all, a thorough review of the collected material is carried out in order to screen out maps that are not subject to development. Cards with erroneous and doubtful entries, as well as cards of children with pronounced deviations in health status are not included: endocrine disorders, bone tuberculosis, the consequences of poliomyelitis, recent severe infectious diseases, etc. Cards indicating severe rickets, malnutrition III are also excluded. degrees, cards of premature and twins. Thus, in statistical development, only maps of practically healthy children who do not have sharp health problems are used to derive physical development standards. After viewing the material, it is divided into groups, which are a homogeneous statistical aggregate by age, sex, place of residence, etc. Each age and sex group must be represented by at least 100 cards. After grouping the material, variation series are compiled separately for each feature. Then the average values are calculated - a simple, weighted or arithmetic average is calculated according to the method of moments; average parameters: 1) standard deviation (σ), which is a measure of the typicality of the arithmetic mean for the population from which it is obtained; 2) the average error of the arithmetic mean (m), which is a measure of the reliability of the average value and allows, with varying degrees of probability, to determine the limits of fluctuations in the average in the general population. There are various ways of individual and group assessment of the physical development of the population. Methods of individual assessment of physical development 1. Assessment of physical development by the method of indices. For a long time, the index method was used to assess physical development. Indices of physical development are the ratio of individual anthropometric indicators, expressed in mathematical formulas. Different indexes include a different number of features. When using this technique, it is assumed that the dimensions of the body change proportionally with respect to each other. However, it has now been established that anthropometric indicators change disproportionately, so the value of indices for assessing physical development has decreased. 2. Assessment of physical development by the method of sigma deviations. The sigma deviation method is the simplest. In this case, the indicators of the physical development of the individual are compared with the arithmetic mean of the corresponding age and sex groups, taken from the table of standards. The data of the subject, as a rule, differ to some extent from the average indicators, either in the direction of an increase or in the direction of a decrease in the sign. To judge the degree of their difference, this difference with the corresponding sign (+ or -) is divided by the standard deviation (σ), obtaining the so-called sigma deviation. This is how it is established by what fraction of the sigma or by how many sigmas the individual indicator differs from the arithmetic mean of this feature of a given age and sex group. Consistently determine sigma deviations for height, weight, chest circumference. The degree of physical development is judged by the magnitude of sigma deviations. Such an assessment is carried out according to the formula: V - M / σ, where V is a variant of one or another feature; M is the arithmetic mean of a trait for a given age and sex group; σ - standard deviation. The results are evaluated as follows: with average physical development, individual values differ from age standards (M) by no more than one sigma in one direction or another. Depending on the size of sigma deviations, 5 groups of physical development are distinguished (Table 6). Table 6  Example 1. The average height of 10-year-old boys is 137 cm, the standard deviation is 5,2 cm, then a student of this age, having a height of 142 cm, will receive a height estimate in sigma equal to 142 - 137 / 5,2 = 0,96, i.e., the height of the student is within M + 1σ and is assessed as average, normal growth. The final data obtained for each sign of physical development, in sigma terms, can be visually represented in the form of the so-called anthropometric profile, which is performed graphically and shows the differences in the physique of a given person from other persons. This method is widely used in dynamic medical monitoring of the physical development of children, athletes, military personnel and other population groups. To build a profile of physical development, horizontal lines are drawn at an equal distance from each other according to the number of evaluated signs. Most often, 3 main indicators are used: height, weight, chest circumference. In the middle of these lines, an average vertical line is drawn, corresponding to M of these indicators. On the right side of this center line at an equal distance, the boundaries of deviations within +1σ, +2σ, +3σ are applied, and on the left - respectively - 1σ, - 2σ, - Зσ. Vertical lines are also drawn along these boundaries. The magnitude of the sigma deviations of each feature is plotted as a dot on the corresponding horizontal line. Then these points are connected in series. When assessing physical development, they proceed from the location of the profile. In addition to the level of physical development, with the help of the anthropometric profile, the proportionality of development is determined. With proportional development, the points denoting sigmoid deviations of individual signs lie on the same vertical or are separated from each other by no more than 1 cm. Example 2. A 9-year-old girl has a height of 131 cm, weight - 28,5 kg, chest circumference - 65,5 cm. To determine the level of physical development of girls, according to the table of standards, they find the arithmetic mean and standard deviation of height, weight and chest circumference for girls of 9 years old. Based on these data, a table for calculating sigma deviations is built (Table 7). Table 7 Table for calculating sigma deviations  According to the magnitude of sigma deviations of the main features, a graph is built - an anthropometric profile of physical development (see above). Conclusion: the physical development of the girl is assessed as average and proportional. The disadvantage of the method of assessing physical development by determining sigma deviations and constructing an anthropometric profile is that each sign of physical development is assessed in isolation, without correlation with others. 3. Assessment of physical development on a regression scale. This method is the most widely used, as it makes it possible to identify persons with harmonious and disharmonic development. Its advantage lies in the fact that it allows to give a comprehensive assessment of physical development on the basis of a set of signs in their relationship, since none of the signs, taken individually, can give an objective and complete assessment of physical development. The essence of the regression scale assessment method is as follows: if there is a relationship between two features, there is a consistent increase in the values of one of the features (for example, weight) with a corresponding increase in the other feature (for example, growth) with a direct relationship and a similar sequential decrease with a reverse one. Evaluation tables for a comprehensive assessment of physical development indicators in the form of regression scales are compiled using a number of parameters. These include: 1) correlation coefficient (p), expressing the magnitude of the relationship between the features; 2) the regression coefficient (R), showing the amount of change in one attribute when the other changes by one; 3) regression sigma, or partial sigma (σR), which serves to determine the magnitude of the individual deviation of a trait associated with another. The method of regression scales provides for the distribution of signs of physical development into two categories: independent (height) and dependent (weight and chest circumference). Thus, growth is considered the leading sign of physical development and a necessary basis for a correct assessment. With the normal development of the child, an increase in height is accompanied by an increase in body weight and chest circumference. The tables, compiled on a regression scale for each age and sex group, contain the characteristics of five height groups (average, below average, above average, short and tall height). Growth values are given for each group in whole numbers with an interval of 1 cm. The normative table includes theoretical values of dependent signs, calculated taking into account the relationship between height and weight, height and chest circumference according to the regression coefficient. Since a certain height corresponds to several values of weight or chest circumference, the table shows the boundaries of fluctuation of dependent signs, established using sigma regression (σR). Depending on the ratio between body weight, chest circumference and height, physical development is considered harmonious (normal), disharmonious and sharply disharmonious. Physical development is considered to be harmonious, in which body weight and chest circumference correspond to body length or differ from proper within one regression sigma (σR). Physical development is considered disharmonious, in which body weight and chest circumference lag behind due by 1,1 - 2σR, as well as more due by the same value. Sharply disharmonious should be considered physical development, in which body weight and chest circumference lag behind due by 2σR and more or exceed due by the same amount. When assessing physical development on a regression scale, it is determined which growth group the subject belongs to, after which the proper weight and chest circumference are found. In the table of regression scales, the values of dependent signs are presented with fluctuation boundaries within ±1σ, which corresponds to normal, harmonious development. Therefore, in some cases, a simple comparison is sufficient to assess physical development. Assessment of physical development on regression scales is carried out as follows: the difference between the survey data and the due values is calculated, expressing it in regression sigmas (σR), i.e. the difference is divided by the sigma of the regression. Example 3. An 8-year-old boy (city dweller) has a height of 129 cm, weight - 30,1 kg, chest circumference - 65 cm. According to the evaluation table, a height of 129 cm belongs to the group of average height values, it corresponds to a weight of 28,2 kg. The boy's weight is 1,9 kg higher than the standard (30,1 kg - 28,2 kg = 1,9 kg). This difference must be divided by the partial sigma σR \u2,88d 1,9 x (2,88 / 0,65) \uXNUMXd XNUMX (σ). Thus, the boy's weight is higher than the standard one by 0,65σ and is within the average values. Chest circumference - 65 cm, 2,2 cm higher than the standard (65 cm - 62,8 cm = +2,2), in terms of regression sigma it is equal to 2,2 / 3,37 - 0,65σ, i.e. The circumference of the chest is also in the middle range. Consequently, the physical development of the boy is average, harmonious. Example 4. An 7-year-old boy (city dweller) has a height of 128 cm, weight - 32 kg, chest circumference - 68 cm. According to the evaluation table, growth belongs to the average group, weight is higher than the standard (32 - 26,8 = 5,2) by 5,2 kg, which is +2,09σ (5,2 / 2,48 = +2,09σ). The circumference of the chest is higher than the standard (68 cm - 61,4 cm = 6,6 cm) by 6,6 cm, which is +2,11σ (6,6 / 3,12 = +2,11σ). Consequently, the physical development of the boy with an average height is above average (disharmonious). In an individual assessment of physical development by any method, it is necessary to take into account not only the absolute values of the main somatometric indicators, but also the dynamics of these indicators, as well as descriptive signs - muscle development, fat deposition, the degree of puberty, etc. Health indicators must also be taken into account. Only on the basis of an analysis of all these data can a correct assessment of the physical development of a growing organism be given. Methodology for group assessment of physical development Assessment of the physical development of the team is carried out by analyzing age-related changes in the average values of their standard deviations, annual increases in indicators in different age periods; identifying gender differences in the dynamics of physical development indicators. However, such a characteristic is often insufficient and it becomes necessary to assess the changes in the physical development of a children's or adolescent team that have occurred over a given period of time, or to compare the physical development of two different teams. Comparative assessment of the level of physical development of different teams or the same team in dynamics is made by determining significant differences in the average values of the main features. In both cases, indicators of the physical development of homogeneous age and sex groups are subject to comparison. The significance of differences in the average values of the studied characteristics is determined by calculating the reliability criterion (criterion t) according to the formula:  where M1 and M2 - arithmetic averages; m1 and m2 - mean errors of mean values. The resulting criterion t is estimated as follows: if t ≥ 2, then the differences in the mean values are significant, if t < 2, then the differences are not proven. Example 5. В The city of N. is conducting dynamic monitoring of the physical development of school-age residents. The following indicators of physical development in 10-year-old girls have been established. Table 8  When comparing the indicators of 1997 and 2000. their increase was found. The validity of these differences needs to be determined. Then growth t = (146,1 - 145,2) / (√0,642 + 0,522) = 1,01; t weight = (37,4 - 35,8) / (√0,472 + 0,462) = 3,18; t env. chest = (69,6 - 69,0) / (√0,512 + 0,452) = 0,88. Thus, only t weight > 2. Therefore, over the indicated period of time, 10-year-old girls experienced a significant increase in weight. Acceleration A feature of the modern era of the development of human society is the acceleration of the pace of physical development of children and adolescents in comparison with previous generations. The phenomenon of acceleration is typical for most economically developed countries and to some extent manifests itself in representatives of all nations and affects all age and sex groups of the population. The reasons for the acceleration are still unclear. None of the proposed hypotheses is able to explain this phenomenon. It is known that the following factors influence the occurrence of acceleration shifts in the body: 1) more intense insolation; 2) improving the nutrition of children (increasing the consumption of animal proteins and fats, vitamins, concentrates for feeding infants); 3) a genetic factor (constant mixing of the population, heterolocal marriages and acceleration of the development of offspring due to heterosis, i.e., the property of hybrids of the first generation to surpass the best of the parental forms in a number of ways). In the origin of acceleration, the total impact of biological and social factors matters. The acceleration process is quite manageable and depends on the corresponding changes in conditions and living standards, and socio-economic factors, playing the role of regulatory mechanisms, affect its pace. Population-genetic processes are of great importance. The mobility of the population, contributing to the expansion of the circle of marital ties, creates genetic prerequisites for an increase in the variability of the somatic type of the population, which contributes to an increase in the parameters of physical development. The process of acceleration is observed already in the period of intrauterine development of the fetus - there is an increase in the length and body weight of children at birth. In adolescents, there is an acceleration in the rate of growth and body weight, earlier puberty and ossification of the skeleton. Among children with accelerated development, subgroups with harmonic and disharmonic acceleration are distinguished. With harmonic acceleration, there is a parallel acceleration of growth and biological maturation, which leads to an earlier end of childhood. With disharmonious acceleration, the acceleration of maturation may not be accompanied by an acceleration of growth and sexual development. Acceleration cannot be considered unequivocally as a positive or negative process. It poses many problems for modern doctors, namely: 1) earlier biological maturation, which occurs before social maturity and civil capacity (earlier onset of sexual activity, an increase in the number of young mothers, the number of abortions among minors, etc.); 2) the need to establish new forms of labor, physical activity, nutrition, standards for children's clothing, shoes, furniture and household items; 3) the increasing variability of all signs of age-related development and maturation, the complication of the differentiation of the norm and pathology. Acceleration leaves its mark on the development of the body at an older age, as well as on the nature of the manifestation of a number of diseases. For example, in women, the onset of menopause is delayed, there is an increase in the incidence of acute forms of rheumatism in young children, and juvenile hypertension is more common. Acceleration shifts are periodic in nature and have short periods of stabilization. At the end of the XX century. there is a slowdown in acceleration - "deselration" - a phenomenon opposite to acceleration. Incidence Morbidity, along with sanitary-demographic indicators and indicators of physical development, is one of the most important criteria characterizing the health of the population. Data on the incidence and structure of morbidity, as well as the spread of diseases, are of great importance in various areas of health management, in particular they are required for: 1) training and proper placement of personnel; 2) network planning; 3) rational organization of various types of medical and social assistance; 4) carrying out preventive and health-improving measures; 5) control over the quality of medical care. With the help of population morbidity indicators, the activities of doctors, medical institutions, and health authorities are evaluated. Morbidity refers to data on the prevalence, structure and dynamics of various diseases registered among the population as a whole or in its individual groups (territorial, age, gender, occupational, etc.). When studying morbidity, it is necessary to use a single methodological basis, including the correct use of terms and their common understanding, a unified system of accounting, collection and analysis of information. Morbidity (primary morbidity) - a set of new, nowhere previously recorded and first detected diseases in a given calendar year. Prevalence (morbidity) - the totality of all existing diseases, both first detected in a given year and in previous years, for which the patient again sought medical help in a given calendar year. Pathological affection - a set of diseases, as well as premorbid forms and conditions identified during medical examinations. Accumulated incidence - all cases of registered diseases for a number of years. The true morbidity is the sum of all diseases identified according to the data of visits and medical examinations in a given year. For in-depth study and analysis of the levels, structure and dynamics of morbidity, a mandatory registration of the diseases of patients seeking medical care in all medical institutions has been introduced; patients undergoing inpatient treatment, as well as pathological conditions identified during medical examinations. Information about morbidity is also obtained in the analysis of mortality. In the incidence statistics, it is customary to single out: 1) morbidity according to the data on seeking medical care: a) general morbidity; b) infectious disease; c) incidence of major non-epidemic diseases; d) hospitalized morbidity; e) morbidity with temporary disability; 2) morbidity according to medical examinations; 3) morbidity according to the causes of death. The study of morbidity is carried out in the same sequence and at the same stages as any statistical study: drawing up a plan and program, collecting material, processing and analyzing it. Methodology for studying general morbidity General morbidity is a set of diseases (acute and chronic) among certain groups of the population for a certain calendar year. The study of general morbidity is carried out according to the data of outpatient clinics. General morbidity data are needed to fully characterize the health of the population. The unit of observation is the patient's primary visit to the doctor about a specific disease in a given calendar year. The main accounting document is the "Statistical coupon for registration of final (refined) diagnoses" (f. 025-2 / y). "Statistical coupon" is filled in for each case of an acute disease (with a "+" sign), for each case of a chronic disease diagnosed for the first time in life (with a "+" sign), as well as for the first visit in the current calendar year for a previously diagnosed chronic disease (with "-" sign). Chronic diseases are taken into account only once a year; exacerbations of chronic diseases are not taken into account again this year as diseases. Based on the development of data on "Statistical coupons", a "Report on the incidence" is filled out (form 1). When studying the primary morbidity of the population, according to the data of appealability, "Statistical coupons" filled out only for newly diagnosed diseases (with a "+" sign) are taken into account. When studying the prevalence of diseases, according to the data on the appealability, all statistical coupons filled out during the year are taken into account, both in cases of newly diagnosed diagnoses with a "+" sign, and those that have been transferred from previous years with a "-" sign. When analyzing the overall incidence, it is customary to calculate the following indicators. Primary morbidity: number of diseases newly diagnosed in a year x 1000 (10, 000) / average annual population. Prevalence: number of diseases first detected in a year and re-registered from previous years x 1000 (10, 000) / average annual population. General incidence rates give only a general idea of the incidence rate. More accurately characterize the general incidence of special indicators (age and sex, according to diagnoses, professions, etc.). Age-sex incidence rates: number of diseases detected per year in persons of this sex and age x 1000 (10, 000) / average annual population of this sex and age. Overall morbidity rate by diagnosis: number of diseases diagnosed per year x 1000 (10, 000) / average annual population. Similarly, special prevalence rates are calculated by sex, age, diagnosis, etc. The following indicators allow assessing the severity of the course of the disease. Structure of general morbidity (share of certain diseases in the total morbidity): the number of diseases with this diagnosis detected per year x 1000 / total number of diseases. Mortality rate: the number of deaths from this disease per year x 1000(10, 000) / average annual population. Lethality rate: the number of deaths from this disease per year x 1000 / the number of patients with this disease. Mortality and mortality rates can also be calculated by sex, age, profession, etc. When analyzing the morbidity rate according to the data on seeking medical care, it should be remembered that it depends on the population's seeking medical care. The accessibility, in turn, is influenced by the availability of medical care, the medical activity of the population, material well-being, the qualifications of doctors and other factors. Methodology for studying infectious morbidity The Russian Federation has a strict control system for infectious diseases. Special obligatory registration of infectious diseases is associated with the need for current and preventive anti-epidemic measures. Information about each case of detection of an infectious disease must be submitted to the district or city centers for sanitary and epidemiological supervision (TSSEN). All infectious diseases, depending on the method of notification about them, can be divided into four groups, each of which has its own system for collecting information and processing data. 1. Quarantine diseases - especially dangerous infections (plague, cholera, smallpox, yellow fever, relapsing fever) are characterized by high contagiousness and high mortality, to which international quarantine restrictions are applied in accordance with international health regulations. When quarantine diseases are detected or suspected, not only the heads of the sanitary and epidemiological service, but also the health authorities up to the Ministry of Health of the Russian Federation are immediately informed. In case of detection of quarantine diseases, emergency measures are applied, including the creation of emergency anti-epidemic commissions (EPC). 2. About diseases such as influenza, acute respiratory infections, medical institutions submit to the center of sanitary and epidemiological supervision total (digital) information for the month, and during the epidemic - daily in the form No. 85-flu, which is compiled on the basis of "Statistical coupons for registration of final (refined) diagnoses. 3. Diseases, each case of which is reported to the Sanitary and Epidemiological Surveillance Center with detailed information: typhoid, paratyphoid, dysentery, enteritis, tularemia, anthrax, brucellosis, diphtheria, measles, whooping cough, mumps, chickenpox, rubella, meningitis, encephalitis , infectious hepatitis, scarlet fever, tetanus, poliomyelitis, rabies, rickettsiosis (including typhus), malaria, leptospirosis, sepsis in children of the first year of life, hemorrhagic fever and psittacosis. If these diseases are detected, the "Emergency notification of an infectious disease, food, acute occupational poisoning, unusual reaction to vaccination" (f. 058 / y) is filled out by doctors or paramedical personnel of medical institutions of all departments and is transmitted to the district within 12 hours or city CSEN. 4. Diseases that are registered as the most important non-epidemic diseases with simultaneous information from sanitary and epidemiological surveillance services (bacillary form of tuberculosis, syphilis, gonorrhea, fungal diseases, trachoma). Not only a "Notice of a patient with a first-ever diagnosed active tuberculosis, venereal disease, trichophytosis, microsporia, favus, scabies, trachoma" (f. 089 / y), but also an "Emergency notice of an infectious disease" (f. 058) is issued /y). Emergency notifications sent to the CSES are registered in the "Journal of Infectious Diseases" (f. 060 / y), which serves for personal registration of patients with infectious diseases and control of the movement of notifications. The journal is kept in all medical institutions, medical offices of schools, preschool institutions, in the Central Sanitary and Epidemiological Service and is used to compile a monthly report on infectious diseases. On the basis of the entries in this journal, the CSES compiles a "Report on the Movement of Infectious Diseases" (f. 85-inf.) with an analysis of data for each month, quarter, half year and year. For a detailed analysis of each case of infectious morbidity, the "Card of the epidemiological examination of the focus of infectious diseases" (f. 357 / y), filled out in the TsSEN, is used. In the analysis of infectious morbidity, the following indicators are calculated. General indicator of infectious morbidity: number of infectious diseases detected per year x 1000 (10, 000) / average annual population. Age-sex indicators of infectious morbidity: number of infectious diseases detected per year in persons of this sex and age x 1000 (10, 000) / average annual population of this sex and age. The indicator of infectious morbidity according to diagnoses: number of diseases diagnosed per year x 1000 (10, 000) / average annual population. The structure of infectious morbidity (extensive indicator): number of diseases diagnosed per year x 100% / total number of infectious diseases. The share (share) of infectious morbidity in the total morbidity: number of infectious diseases detected per year x 100% / total number of diseases. focality (intensive indicator): the number of identified infectious patients with this disease / the number of foci of this disease. Mortality rate (characterizes the severity of the disease): the number of deaths from a given infectious disease x 1000 (10, 000) / average annual population. Lethality rate (extensive indicator): the number of deaths from this infectious disease x 100 / the number of patients with this disease. In an in-depth study of infectious morbidity, seasonality, the frequency of detected bacteria carriers, the effectiveness of preventive vaccinations, and other things are analyzed, which enables doctors to develop the necessary measures to combat infectious diseases. Methodology for studying the most important non-epidemic diseases The organization of a special record of such major non-epidemic diseases as tuberculosis, venereal diseases, mycoses (trichophytosis, microsporia, favus, scabies), trachoma, malignant neoplasms and mental illness is due to the fact that they require early detection, a comprehensive examination of patients, taking them for dispensary registration, constant observation and special treatment, and in some cases - and identification of contacts. When they are found, a “Notice of a patient with a first-ever diagnosed active tuberculosis, venereal disease, trichophytosis, microsporia, favus, scabies, trachoma, mental illness” (f. 089 / y) or a “Notice of a patient with a first-ever diagnosed diagnosis of cancer or other malignant neoplasm "(f. 090 / y). "Notice" (f. 089 / y) is compiled by doctors of all health facilities, regardless of their specialty, place of work and conditions for detecting the disease for all patients who have a disease for the first time in their life. Nursing staff is a notice only for patients with scabies. "Notification" (f. 090 / y) is compiled by doctors of the general and special network of medical institutions in which the patient was diagnosed with a malignant neoplasm for the first time in his life. Notifications are drawn up for patients in whom the disease is detected: 1) when self-referring to a polyclinic for medical care; 2) during targeted and periodic preventive examinations; 3) during a medical examination; 4) during examination in a hospital; 5) during the operation; 6) at autopsy; 7) when reconciling information about those who died from malignant neoplasms with the data of registry offices and statistical offices, if it turns out that the diagnosis was established after death. Compiled notices (f. 089 / y) or (f. 090 / y) are sent within three days to the appropriate dispensaries (anti-tuberculosis, dermato-venereal, neuropsychiatric, oncological) at the place of residence of the patient. Statistical reports compiled in dispensaries contain information sufficient to analyze the incidence of individual diseases, their stages and localization, sex and age, and the place of residence of the patient. Based on these data, incidence rates are calculated. When analyzing the incidence of the most important non-epidemic diseases, certain indicators are calculated. General incidence rate of the most important non-epidemic diseases (frequency of non-epidemic diseases): number of non-epidemic cases reported for the first time in a given year x 1000 (10, 000) / average population. Prevalence of the most important non-epidemic diseases: number of cases of non-epidemic diseases first reported in the current year and earlier x 1000 (10, 000) / average population. Incidence rate of one or another major non-epidemic disease - the number of newly registered certain major non-epidemic diseases in a given year per 1000 (10, 000) population. Prevalence rate for a major non-epidemic disease - the number of certain major non-epidemic diseases first registered in a given year and transferred from previous years per 1000 (10, 000) population. The incidence rate of the most important non-epidemic diseases depending on age, gender, profession, place of residence and other - the number of the most important non-epidemic diseases registered for the first time in a given year among persons of a certain sex, age, profession per 1000 (10, 000) population of a certain sex, age, profession, etc. Morbidity structure of the most important non-epidemic diseases is the percentage of a major non-epidemic disease reported in a given year to the total number of all major non-epidemic diseases. Lethality rate - the number of deaths from one or another major non-epidemic disease in a given year per 100 registered patients of the corresponding non-epidemic disease. Methodology for studying hospitalized morbidity Hospitalization plays an important role in health statistics. The unit of account in this case is the case of hospitalization of the patient in the hospital, and the accounting document is the "Statistical card of the patient who left the hospital" (f. 066 / y), which is compiled on the basis of the "Medical card of the hospital patient" (f. 003 / y) and is a statistical document containing information about the patient who left (discharged, died) from the hospital. Based on the development of "Statistical cards of the hospitalized" and annual reports, the following indicators of hospitalized morbidity are calculated. Frequency (level) of hospitalization: number of hospitalized per year x 1000 / average annual population. Hospitalization rate: number of hospitalized per year x 1000 / number requiring hospitalization. The frequency of hospitalizations for this disease: number of hospitalized for this disease per year x 1000 / average annual population. Structure (composition) of hospitalized morbidity: number of hospitalized with selected diseases x 100 / total number of hospitalized. The composition of hospitalized patients by sex, age, profession and other groups: number of hospitalized by gender, age, etc. x 100 / total number of hospitalized. Average duration of hospitalization: number of hospital days spent by patients per year / total number of hospitalized. Hospital mortality rate: number of deaths x 100 / number of hospital discharges (sum of discharged + deaths). The last two indicators can be calculated both for all patients and for patients with individual diseases. According to the indicators of hospitalized morbidity, it is impossible to judge the prevalence of a particular type of pathology, but they give an idea of the most severe pathology, the nature and volume of medical care, the duration and outcomes of treatment. Methodology for studying morbidity with temporary disability The study of morbidity with temporary disability is of great medical, social and economic importance. Morbidity with temporary disability has a number of features that distinguish it from the general morbidity of the population. The unit of observation in the study of morbidity with temporary disability is each case of disability in a given year. Each case of disability is registered with a certificate of incapacity for work, which is issued not only for diseases and injuries, but also for caring for the sick, during pregnancy, childbirth, quarantine, prosthetics, sanatorium treatment. Based on the development of data from sick leave sheets, a "Report on the incidence of temporary disability" (f. 016) is compiled, which is designed to record and analyze temporary disability of workers and is compiled monthly, quarterly, for half a year and for a year. For the analysis of morbidity with temporary disability, the following indicators are calculated: Number of disability cases per 100 employees: number of all cases of incapacity for work x 100 / average number of employees. Number of days of incapacity for work per 100 employees: number of all days of incapacity for work x 100 / average number of employees. Average duration of one case of incapacity for work: number of days of incapacity for work / number of cases of incapacity for work. Morbidity structure with temporary disability in days: number of days of incapacity for work for this disease x 100 / total number of days of incapacity for work. The structure of morbidity with temporary disability in cases of: number of disability cases for this disease x 100 / total number of disability cases. "Health Index" is the proportion of those who are not ill among all workers: the number of those who have never fallen ill in a given year x 100 / the number of employees in a given enterprise. The first three indicators are calculated as a whole for all diseases, and separately for each disease. The number of cases of incapacity for work per 100 workers indicates the level of illness among workers. The number of days of disability per 100 employees depends on many factors that affect the duration of disability and characterizes the severity of the disease. Methodology for studying morbidity according to medical examinations Medical (preventive) examinations are one of the forms of medical and preventive care, which consists in the active examination of the population for the purpose of early detection of diseases. They provide the most complete information about all chronic and acute diseases with clinical manifestations available at the time of examination, as well as about subclinical forms. Medical examinations are divided into: 1) preliminary; 2) periodic; 3) target. All contingents subjected to preliminary and periodic medical examinations can be divided into three groups: 1) employees of enterprises, institutions and organizations that have contact with adverse production factors; 2) employees of food, children's and some municipal institutions who, upon entering a job and subsequently after a certain period of time, undergo a bacteriological examination to identify infectious diseases or bacillus carriers, since they can become a source of mass infection; 3) children, adolescents, students of vocational schools and secondary specialized educational institutions, full-time students. Preliminary medical examinations make it possible to determine the compliance of the state of health with the requirements of the profession or training, as well as to identify diseases that can worsen and progress in conditions of work with adverse factors of a professional nature or in the process of study. The main task of periodic medical examinations is to identify early signs of occupational diseases or poisoning, as well as diseases that are not etiologically related to the profession, but in which continued contact with adverse factors associated with professional activity poses a health hazard. Targeted medical examinations are carried out for the early detection of a number of diseases (tuberculosis, malignant neoplasms, diseases of the circulatory system, respiratory diseases, gynecological diseases, etc.) during simultaneous examinations in organized groups or during examinations of all persons seeking medical care in medical institutions ). The results of medical examinations are recorded in the following documents of health facilities: 1) "Card subject to periodic inspection" (f. 046 / y) for persons undergoing mandatory periodic inspections; 2) "Medical record of an outpatient" (f. 025 / y); 3) "History of the development of the child" (f. 112 / y); 4) "Medical card of the child" (f. 026 / y) for schools, boarding schools, orphanages, kindergartens, nursery gardens; 5) "Medical record of a university student, student of a secondary specialized educational institution" (f. 025-3 / y); 6) "Medical examination record card" (f. 131 / y) for all persons living, students attending preschool institutions in the area of the polyclinic, working at enterprises and undergoing annual medical examinations; 7) "Map of prophylactically examined for the purpose of detection" (f. 047 / y) - serves to register examinations carried out for the purpose of early detection of individual forms and groups of diseases. It is conducted in all medical and preventive institutions that conduct targeted examinations of the population, and is used to record persons who have applied for a preventive examination. The card is not filled out for persons subject to periodic inspections, since targeted inspections of these contingents are carried out simultaneously with the periodic inspection (join it) and are registered in f. 046/y; 8) "List of persons subject to targeted medical examination" (f. 048 / y), which is filled in instead of f. 047 / y in small medical institutions, where it is impractical to create special card indexes of those examined. The documents listed above allow: 1) get an accurate idea of the prevalence of pathology among the population; 2) determine the dynamics of its change; 3) evaluate the effectiveness of the treatment; 4) view organizational activities for a number of years. In order for a medical examination to be sufficiently effective, it is necessary to ensure its clear organization, the involvement of highly qualified specialists, and the use of modern technology. For the analysis of morbidity according to medical examinations, the following indicators are used. The frequency of detected diseases during preventive examinations: number of diseases detected during medical examination x 1000 / number of all examined. The frequency of detected diseases during preventive examinations for individual nosological forms: the number of diseases with the given diagnosis revealed during medical examinations x 1000 / the number of all examined. The structure of morbidity according to the data of medical examinations: number of persons with this disease x 100 / number of all identified patients. "Health Index": number of healthy persons x 100 / number of all examined. Methodology for studying morbidity according to data on the causes of death Morbidity according to the causes of death is studied for the year according to the "Medical certificate of death" and "Medical certificate of perinatal death". The unit of population in the study of this type of morbidity is each deceased in a given year. In the analysis of morbidity according to the causes of death, the following indicators are used. Total mortality rate: number of deaths per year x 1000 / average annual population. Mortality rate depending on the disease: the number of deaths from a particular disease per year x 1000 / average annual population. Mortality rate depending on sex, age and other groups: number of deaths per year x 1000 / average annual population. Structure of causes of death: number of deaths from specific causes x 100 / number of all deaths. A detailed description of mortality rates is given in the "Demography" section. When taking into account the incidence of the population according to the causes of death, the most severe diseases that ended in death are identified. The study of the causes of death makes it possible to establish not only the nature and severity of the disease, but also shortcomings in the organization of medical care for the population. Disability The classification of disability is based on two main concepts: 1) the degree of disability (3 groups of disability); 2) causes of disability (6 causes of disability). The severity of disability can be different - from disability in the main specialty and transfer to easier work to its complete loss in all types of professional activities. Depending on the degree of loss or disability, there are three groups of disability. The first group of disability is established: 1) persons who, due to persistent and severe violations of the functions of the body, have experienced a complete permanent or long-term disability, in need of daily, systematic care, assistance or supervision; 2) in some cases - to persons with persistent, pronounced functional impairments and in need of outside care or assistance, but who can be attracted and adapted to certain types of labor activity in specially organized conditions (work at home, special production, work equipment and etc.). The second group of disability is established: 1) persons with a complete permanent or long-term disability due to a violation of the functions of the body, but not in need of constant outside care, assistance or supervision; 2) persons for whom all types of labor are contraindicated for a long period due to the possibility of worsening the course of the disease under the influence of labor activity; 3) persons with severe chronic diseases, with combined defects of the musculoskeletal system and significant loss of vision, for whom labor is not contraindicated, but is available only in conditions specially created for them. The third group of disability is established: 1) if it is necessary to transfer for health reasons to work in another profession (specialty) of lower qualification due to the inability to continue working in the previous profession (specialty); 2) if necessary, due to health reasons, significant changes in working conditions in their profession, which lead to a significant reduction in the volume of production activities and, thereby, to a decrease in qualifications; 3) with a significant restriction of the possibility of employment due to pronounced functional impairments in working persons or those who have not previously worked; 4) regardless of the work performed, with anatomical defects or deformities that lead to dysfunction and significant difficulties in the performance of professional work; 5) persons who are not allowed to perform their work for epidemiological reasons (for example, with tuberculosis). For dynamic monitoring of the state of health and ability to work, disabled people of group I are examined after 2 years, and disabled people of groups II and III - after a year. In case of serious illnesses and in the absence of prospects for improving the clinical and labor prognosis, the disability group is established without specifying the re-examination period. Indefinitely, a disability group is established for persons who have reached retirement age, as well as for disabled people of groups I and II, for whom the disability group has not changed or a higher group has been established over the past 15 years. Disability is classified not only by the degree of loss or disability, but also depending on the reasons that led to it. Depending on the cause of disability, legislation establishes the amount of pensions, the volume and nature of other types of social assistance. Disability due to a general illness is established in cases where the loss or disability occurred during the period of work, study or after the termination of work. Establishing this cause means that the disease that led to disability is not among the occupational diseases. If the injury that caused the disability is not related to production or the performance of public or state duties, but is received at home, on the street, on vacation, then the cause of the disability is established as a general disease. Disability due to an occupational disease is established in cases where the impact of an occupational factor was the determining etiological moment in the development of the disease and subsequent disability, when the influence on the development of this disease of other factors not related to working conditions (such as infection, living conditions, etc.) . In addition, disability due to an occupational disease is established when its complications or when an occupational disease significantly affected the course of a previously existing disease of non-occupational etiology. Disability due to an industrial injury as a cause of disability is established in cases where the injury that led to it occurred under circumstances directly or indirectly related to production and was regarded as an accident at work, as well as in the performance of the duty of a citizen of the Russian Federation. Disability from childhood is established in those cases when it occurred as a result of congenital diseases, illnesses and injuries at the age of 16 years (for students - up to 18 years) and before the start of employment. Disability before the start of work is established in cases where the disease or injury occurred at the age of over 16 years (for students - over 18), but before the start of work. Disability in former military personnel Establishing the fact of permanent disability (disability) is a complex and responsible process, in which both healthcare institutions (hospitals, clinics, dispensaries) and institutions of the social protection system (medical and social expertise) take part. Therefore, the attending physicians and specialists of the clinical expert commissions of medical institutions should be well versed in the issues of examination of permanent disability. If there are indications for referral of a patient to a medical and social examination (MSE), health facilities issue a "Referral to the ITU" (f. 088 / y). The following documents are filled in the ITU Bureau: "The certificate of examination in the ITU", "Book of minutes of the meetings of the ITU", "Statistical coupon for the certificate of examination in the ITU", an annual report is drawn up on f. 7. Detailed statistical information on the composition of persons who first came out and are on disability, on the nature of diseases and the causes of disability, can be obtained upon presentation of the "Certificate of examination in the ITU" or "Statistical coupon for the act". Usually, they consider the totality of persons recognized as disabled for the first time (primary disability) and persons registered with social protection authorities, regardless of the time they were recognized as disabled (general disability, contingent of disabled people). For analysis, indicators are calculated: 1) by disability groups; 2) for reasons of disability; 3) types of diseases, etc. An analysis of the dynamics of disability by groups makes it possible to identify positive, negative, stable and variable types of dynamics according to the trend of indicators characterizing an increase or decrease in groups I - II. It is also important to know the numerical change in the contingents of disabled people, to take into account the number of those who left for the year, the main reasons for deregistration. The indicators of disability are as follows. The indicator of primary disability is one of the main criteria for assessing the quality of medical care in outpatient clinics. Primary Disability: number of persons recognized as disabled for the first time during the year x 1000 / total population. Structure of primary disability (by disease, gender, age, etc.): number of persons recognized as disabled for the first time during the year for this disease x 1000 / total number of persons recognized as disabled for the first time during the year. The frequency of primary disability by disability groups: number of persons recognized as disabled of group I (group II, group III) x 1000 / total population. The structure of primary disability by disability groups: number of persons recognized as disabled of group I (II group, III group) x 100 / total number of persons recognized as disabled for the first time during the year. General disability (contingent of disabled people): total number of persons with disabilities (number of persons receiving disability pensions, i.e. for the first time and previously recognized as disabled) x 1000 / total population. In the analysis of general disability, indicators of general disability are calculated by sex, age, causes, disability groups, in various territories. Structure of general disability: number of people with disabilities who have a disability for this disease x 100 / total number of people with disabilities. This indicator is also calculated by sex, age, groups, causes of disability and other characteristics. Change of disability group during examination: the number of persons whose disability group was changed during the examination x 100 / the number of persons with disabilities who underwent re-examination during the year. The share of disabled people who first became disabled among all disabled people: number of persons recognized as disabled for the first time during the year x 100 / total number of disabled. The proportion of people with disabilities since childhood among all people with disabilities: number of persons recognized as disabled since childhood for the first time during the year x 100 / total number of disabled. Movement of the disabled throughout the year: the number of disabled people at the beginning of the year plus the number of primary disabled people for the year minus the number of retired disabled people for the year is equal to the number of disabled people at the end of the year. In recent years, much attention has been paid to the problem of rehabilitation of the disabled. Evaluation of rehabilitation measures is carried out on the basis of three groups of indicators: 1) medical and professional rehabilitation of disabled people; 2) stability of disability groups during re-examination; 3) aggravation of the disability groups of the re-examined. These indicators are calculated on the basis of the data in section V "Results of the re-examination of persons with disabilities" of the report f. 7. The indicators of rehabilitation of the disabled are as follows. 1. Indicators of medical and professional rehabilitation of disabled people: 1) complete rehabilitation: total number of disabled people recognized as disabled x 100 / total number of re-examined disabled people; 2) partial rehabilitation: the total number of recognized disabled persons of group III x 100 / the total number of re-examined disabled persons of groups I and II. 2. Indicators of stability of disability groups: stability of I disability group (II and III disability groups): the total number of disabled people who remained after the next examination in the previous group x 100 / the total number of examined disabled people of this group. 3. Indicators of weighting of disability groups: 1) weighting II group of disability: the number of those transferred to group I (from among the disabled of group II) x 100 / the total number of those examined in group II; 2) weighting III group of disability: the number of those transferred to groups I and II (from among the disabled of group III) x 100 / the total number of those examined in group III. The methodology for studying disability provides not only for the analysis of documents from the ITU and health facilities, but also methods for direct observation of persons with permanent disability in order to characterize their quality of life. Methods of expert assessments of the quality of medical and social assistance to disabled people are also used. The problem of studying disability in our country, as well as other indicators of the health of the population, is very relevant. In Russia, more than 300 people are recognized as disabled for the first time every year. In general, more than 8,5 million people receive disability pensions. In the structure of primary disability, disabled people of group I make up approximately 15%, group II - 60%, group III - 25%. In recent years, there has been an increase in the primary exit to disability. By age, those who first became disabled are distributed as follows: 10-15% are persons of retirement age, 85-90% are the able-bodied population. In the structure of disability due to causes, 1st place is occupied by diseases of the cardiovascular system (more than 30%), 2nd place - by malignant neoplasms (about 20%), 3rd place - by injuries (about 15%). A special place in disability is occupied by the problem of disabled children, who make up more than 200 thousand people in Russia. The structure of disability from childhood is dominated by neuropsychiatric diseases, including mental retardation (more than 50%), followed by diseases of the nervous system, including cerebral palsy, congenital anomalies, consequences of injuries and poisoning. Every year in Russia more than 30 thousand children are born with congenital and hereditary pathologies, of which 2/3 subsequently become disabled, and in 60-80% of cases the disability of children is due to perinatal pathology. International Classification of Diseases and Related Health Problems The International Classification of Diseases (ICD) is a system of grouping diseases and pathological conditions that reflects the current stage in the development of medical science. The ICD is the main regulatory document in the study of public health in the member countries of the World Health Organization. In 1900, in Paris, at an international conference with the participation of 26 states, the Bertillon classification was approved as an international classification with a revision every 10 years. In total, the ICD was revised 10 times. The last revision took place in 1989 in Geneva and was adopted by the 43rd World Health Assembly. On the recommendation of WHO, the Tenth International Statistical Classification of Diseases and Related Health Problems came into force on January 1, 1993; in Russia, it began to operate on January 1, 1998. Purpose and scope of the ICD-10. The classification of diseases can be defined as a system of headings in which specific nosological units are included in accordance with accepted criteria. The purpose of the ICD is to create conditions for the systematic registration, analysis and comparison of data on morbidity and mortality obtained in different countries and regions at different times. The ICD is used to convert the verbal formulation of diagnoses of diseases and other health-related problems into alphanumeric codes that provide easy storage, retrieval and analysis of data. The structure of the ICD-10. The ICD is a variable-axial classification. Its scheme is that the statistical data on diseases are grouped in such a way as to ensure its maximum acceptability for use both for all practical and epidemiological purposes, and for assessing the quality of health care. The following main groups are distinguished: 1) epidemic diseases; 2) constitutional (or general) diseases; 3) local diseases grouped by anatomical localization; 4) developmental diseases; 5) injury. The ICD is built on a decimal system with sequential detailing from large classes (there are 10 in ICD-21) and groups of diseases to three-digit headings and four-digit subheadings up to ten. As classes, for example, infectious and parasitic diseases, neoplasms, injuries and poisonings, diseases of the digestive system and others are presented; as groups - tuberculosis, malignant neoplasms of the genitourinary organs, burns, hernia of the abdominal cavity, etc. The rubrics combine the manifestations of one disease, for example, amoebiasis, pulmonary tuberculosis; they can also include collective concepts: mineral metabolism disorders, adrenal diseases, etc. The most detailed information is given at the level of subheadings. An important part of the ICD is an alphabetical list containing diagnostic terms indicating which heading and subheading they belong to. In ICD-10, diseases are divided into classes as follows (Table 9). Table 9
Headings from I to XVII class refer to diseases and pathological conditions, XIX class - to injuries and poisoning and some other consequences of external factors, the rest of the classes contain a number of modern concepts related to diagnostic data. For example, class XVIII includes symptoms, signs and abnormalities identified in clinical and laboratory studies, class XX "External causes of morbidity and mortality" is used to record any external causes of diseases and pathological conditions. Class XXI "Factors influencing the state of health and admission to health care institutions" is intended to classify data explaining the reason for contacting a health care institution of a person who is not currently sick. The ICD-10 uses an alphanumeric code with a letter as the first character and a number on the second, third and fourth characters of the code. The fourth character follows the decimal point. Thus, the possible code numbers range from A00.0 to Z99.99 (letter U is not used). ICD-10 consists of three volumes: volume 1 - contains the main classification; volume 2 - instructions for use for users; Volume 3 is an alphabetical index to the classification. The concept of a "family" of classifications of diseases and health-related problems. Although the ICD is intended primarily to classify illnesses and injuries that have an official diagnosis, not every problem or reason for seeking medical attention can be indicated by an official diagnosis. Therefore, ICD-10, as already mentioned, provides for the possibility of processing data on a wide range of signs, symptoms, abnormalities found in the process of research, complaints, social circumstances and other health problems that may be indicated instead of a diagnosis in medical records (classes XVIII и XXI). However, the ICD does not always allow the inclusion of sufficiently detailed information on the various characteristics of the conditions being classified. In addition, it was suggested that the ICD should include classifications for additional information relating to health or medical care. However, the core ICD, presented in the three volumes of ICD-10, cannot include all of this additional information and still be accessible and user-friendly. Therefore, the concept of a "family" of classifications was created, including volumes published separately from the main ICD and used as needed. At the center of the "family" is the traditional ICD with its inherent forms and structures. There are two main groups of classifications. Classifications of the first group cover data related to diagnoses and health status, and are built directly on the basis of the ICD by reducing or expanding the list of headings. This group also includes classifications that complement lists of rubrics, which is used to achieve greater clinical detail, for example in variants of the classification adapted for subspecialists. The second group of classifications covers aspects related to health disorders that do not fit into the formal diagnoses of currently known conditions, as well as other classifications related to medical care. This group includes classifications of disability, medical and surgical procedures, and reasons for seeking health care. 1. Classifications based on diagnosis: 1) special lists for statistical development follow directly from the main classification and are used to present data and facilitate the analysis of information on the state of health and its dynamics at the national and international level. There are five such lists: 4 for mortality data and 1 for morbidity data. 2) specialized options combine in one compact volume those sections and headings of the ICD that relate to a particular specialty; they are developed by international teams of specialists. The current options are oncology, dermatology, neurology, rheumatology and orthopedics, pediatrics, mental disorders, dentistry and dentistry. II. Non-diagnostic classifications: 1) procedures used in medicine include diagnostic, preventive, therapeutic, X-ray, medical, surgical and laboratory procedures; 2) the International Classification of Impairment, Disability and Social Insufficiency (ICNST and HF) deals with the consequences of illness, including injuries and impairments. The MCST and HF contain three distinct classifications, each referring to a different disease outcome: a) the classification of disorders represents disorders at the level of a particular organ; b) the classification of disability reflects the consequences of violations in the form of a limitation or inability to carry out activities within the limits considered normal for a person, i.e. it reflects disorders at the level of an individual; c) the classification of social insufficiency characterizes violations in which a person can only perform a limited or cannot perform a very normal role for his position in life (depending on age, gender, social and cultural status), i.e. it reflects the discrepancy between real capabilities and desires of the individual. This classification is not a classification of individuals. This is a classification of circumstances that place a disabled person at a disadvantage compared to other people in terms of social norms. International Nomenclature of Diseases (INB) The main goal of the MNB is to give each nosological unit one recommended name. The main criteria for choosing this name should be: 1) specificity (applicability to one and only one disease); 2) uniqueness (so that the name itself indicates the essence of the disease); 3) etiology (so that the name of the disease is based on its cause). Each disease or syndrome with a recommended name is given an unambiguous concise definition followed by a list of synonyms. The MNB complements the ICD. Statistical classification differs from the nomenclature of diseases by the element of grouping, since the nomenclature must have a separate name for each known disease. LECTURE No. 3. Medical health statistics 1. Organization of the statistical work of a medical institution Health statistics help the heads of the institution to efficiently manage their facility, and doctors of all specialties - to judge the quality and effectiveness of treatment and preventive work. The intensification of the work of medical workers in the conditions of budget-insurance healthcare imposes increased requirements on scientific and organizational factors. Under these conditions, the role and importance of medical statistics in the scientific and practical activities of a medical institution is increasing. Healthcare leaders constantly use statistical data in operational and prognostic work. Only a qualified analysis of statistical data, evaluation of events and appropriate conclusions make it possible to make the right managerial decision, contribute to better organization of work, more accurate planning and forecasting. Statistics help to control the activities of the institution, to manage it promptly, to judge the quality and effectiveness of treatment and preventive work. When drawing up current and long-term work plans, the leader should be based on the study and analysis of trends and patterns in the development of both health care and the health status of the population of his district, city, region, etc. The traditional statistical system in health care is based on the receipt of data in the form of reports, which are compiled in grass-roots institutions and then summarized at intermediate and higher levels. The reporting system has not only advantages (a single program, ensuring comparability, indicators of the amount of work and use of resources, simplicity and low cost of collecting materials), but also certain disadvantages (low efficiency, rigidity, inflexible program, a limited set of information, uncontrolled accounting errors, etc. .). Analysis, generalization of the work done should be carried out by doctors not only on the basis of existing reporting documentation, but also through specially conducted selective statistical studies. The plan of statistical research is drawn up on the organization of work in accordance with the planned program. The main points of the plan are: 1) definition of the object of observation; 2) determination of the period of work at all stages; 3) indication of the type of statistical observation and method; 4) determining the place where observations will be made; 5) finding out by what forces and under whose methodological and organizational leadership the research will be carried out. The organization of statistical research is divided into several stages: 1) the stage of observation; 2) statistical grouping and summary; 3) counting processing; 4) scientific analysis; 5) literary and graphic design of the research data. 2. Organization of statistical accounting and reporting Staffing and organizational structure of the department of medical statistics The functional subdivision of the health facility responsible for the organization of statistical accounting and reporting is the department of medical statistics, which is structurally part of the organizational and methodological department. The head of the department is a statistician. The structure of the department may include the following functional units, depending on the form of health care facilities: 1) the department of statistics in the polyclinic - is responsible for the collection and processing of information received from the outpatient service; 2) department of statistics of the hospital - is responsible for the collection and processing of information received from the departments of the clinical hospital; 3) medical archive - is responsible for the collection, accounting, storage of medical documentation, its selection and issuance according to requirements. The department of statistics should be equipped with automated workstations connected to the local network of health facilities. On the basis of the received data, OMO develops proposals and measures to improve the quality of medical care, organizes statistical accounting and reporting in all health facilities of the region, trains staff on these issues and carries out statistical audits. Accounting and statistics offices in health care facilities carry out work on organizing a primary accounting system, are responsible for the current registration of activities, the correct maintenance of records and providing the management of the institution with the necessary operational and final statistical information. They prepare reports and work with primary documentation. A feature of statistical work is that there are several streams of patient financing - budgetary (attached contingent), direct contracts, voluntary health insurance, paid and compulsory health insurance. Department of Medical Statistics of the Polyclinic The department of medical statistics of the polyclinic carries out work on the collection, processing of primary accounting documentation and the preparation of appropriate reporting forms for the work of the polyclinic. The main primary accounting document is the "Statistical coupon of an outpatient", coming in the form of a generally accepted form No. 025-6 / y-89. Every day, after checking and sorting statistical coupons, they are processed. Information from coupons is processed manually or entered into a computer database through a local network program according to the following parameters: 1) the reason for the appeal; 2) diagnosis; 3) service category; 4) belonging to the main production or work with occupational hazard (for the attached contingent). Coupons from workshop polyclinics and health centers are processed according to the same parameters. Monthly, quarterly reports are prepared on the results of the work of the polyclinic: 1) data on attendance by incidence with distribution by departments of the polyclinic, by doctors and by funding streams (budget, CHI, VHI, contractual, paid); 2) information on attendance by incidence of day hospitals, hospitals at home, an outpatient surgery center and other types of hospital-replacing types of medical care in a similar form; 3) information on attendance by incidence of shop polyclinics and health centers in the same form; 4) information on the attendance of attached contingents with distribution by enterprises and categories (working, non-working, pensioners, war veterans, beneficiaries, employees, etc.); 5) a summary table of attendance by morbidity with distribution by departments of the outpatient service and funding streams. At the end of the year, annual reports of state statistical forms No. 7, 8, 9, 10, 11, 12, 15, 16, 16-VN, 30, 33, 34, 35, 36, 37, 57, 63, 01-C are formed. Dispensary groups of doctors from polyclinics are being processed with the preparation of an appropriate report. Reports (general morbidity, attendance in the XXI class (form No. 12), morbidity in the XIX class (form No. 57)). A report in the form No. 16-VN can be generated in a special program. Reports on the work of workshop polyclinics and health centers, as well as a report f. No. 01-C are formed by manual processing. Department of Medical Statistics of the Hospital In the department of medical statistics of the hospital, work is carried out to collect and process primary accounting documentation and draw up appropriate reporting forms based on the results of the work of the clinical hospital. The main primary accounting forms are the medical card of an inpatient (form No. 003 / y), the card of a person who left the hospital (form No. 066 / y), a sheet for registering the movement of patients and hospital beds (form No. 007 / y). The department receives primary accounting forms from the admission department and clinical departments. Processing of received forms of several types is carried out daily. 1. The movement of patients in departments and in the hospital as a whole: 1) verification of the accuracy of the data specified in the form No. 007 / y; 2) correction of data in the summary table of the movement of patients (form No. 16/y); 3) surname registration of the movement of patients in multidisciplinary departments, intensive care units and cardioreanimation; 4) entering data on the movement of patients per day in a summary table using statistics software; 5) transfer of the report to the city hospitalization bureau. 2. Entering data into the journal of oncological patients with the issuance of appropriate registration forms (No. 027-1 / y, No. 027-2 / y). 3. Entering data into the journal of deceased patients. 4. Statistical processing of forms No. 003/y, 003-1/y, 066/y: 1) registration of case histories coming from departments in f. No. 007/y, specifying the profile and terms of treatment; 2) checking the accuracy and completeness of filling out forms No. 066 / y; 3) withdrawal from the history of coupons to the accompanying sheet of the SSMP (f. No. 114 / y); 4) verification of the compliance of the cipher of the medical history (flows of financing) with the order of receipt, the availability of a referral, the tariff agreement with the TF CHI; 5) coding of case histories with indication of data codes (such as department profile, age of the patient, dates of admission (for emergency surgery, transfer and deceased), date of discharge, number of hospital days, ICD-X disease code, operation code indicating the number of days before and after the operation and its indefiniteness in emergency surgery, the level of comfort of the ward, the category of complexity of the operation, the level of anesthesia, the number of consultations of doctors); 6) sorting of case histories by funding streams (compulsory health insurance, voluntary health insurance, paid services or direct contracts financed from two sources). 5. Entering information into a computer network: for CMI and VHI patients and for patients financed from several sources, it is carried out under direct contracts, letters of guarantee. After processing the information, it is transferred to the financial group for further generation of invoices to the relevant payers. 6. Analysis of the processed case histories with the withdrawal of form No. 066 / y and their sorting by department profiles and discharge dates. Delivery of case histories to the medical archive. 7. Continuous monitoring of the timeliness of the delivery of case histories from clinical departments according to the sheets of records of the movement of patients with a periodic report to the head of the department. Based on the results of the work of the departments and the hospital as a whole, statistical data processing is carried out with the formation of reports. The data from the card of the person who left the hospital is processed with filling in the patient distribution sheets by funding streams for each profile and the patient distribution sheet by attached enterprises. The cards are sorted by diagnosis for each profile. Based on the grouped information, reports are generated in a spreadsheet editor: 1) report on the movement of patients and beds (form No. 16/y); 2) a report on the distribution of patients by departments, profiles and funding streams; 3) a report on the distribution of retired patients by attached enterprises; 4) report on the surgical activities of the hospital by types of operations; 5) report on emergency surgical care; 6) a report on the surgical work of the departments and the hospital as a whole; 7) report on abortions. These reporting forms are compiled quarterly, for half a year, for 9 months and a year. Based on the results of the work for the year, national statistical forms No. 13, 14, 30 are compiled. Statistical accounting and reporting should be organized in accordance with the basics of statistical accounting and reporting adopted in healthcare facilities of the Russian Federation, based on the requirements of guidelines, methodological recommendations of the CSB, the Ministry of Health of the Russian Federation and additional instructions from the administration. The activities of health facilities are taken into account by the primary statistical documentation, divided into seven groups: 1) used in a hospital; 2) for polyclinics; 3) used in a hospital and clinic; 4) for other medical and preventive institutions; 5) for institutions of forensic medical examination; 6) for laboratories; 7) for sanitary and preventive institutions. Based on statistical studies, the department: 1) provides the administration with operational and final statistical information for making optimal management decisions and improving the organization of work, including in matters of planning and forecasting; 2) analyzes the activities of departments and individual services that are part of the health care facility, based on the materials of statistical reports using methods for assessing variability, the typical value of a sign, qualitative and quantitative methods for the reliability of differences and methods for studying the relationship between signs; 3) ensures the reliability of statistical accounting and reporting and provides organizational and methodological guidance on medical statistics; 4) carries out the preparation of annual and other periodic and summary reports; 5) determines the policy in the field of correct execution of medical documentation; 6) participates in the development and implementation of computer programs in the work of the department. The medical archive is designed to collect, record and store medical records, select and issue requested documents for work. The medical archive is located in a room designed for long-term storage of documentation. The archive receives the case histories of retired patients, which are taken into account in the journals, marked, sorted by departments and alphabetically. In the archive, the selection and issuance of case histories per month on applications and, accordingly, the return of previously requested ones are carried out. At the end of the year, the records of retired patients, case histories of deceased patients, and case histories of outpatients are accepted for storage, accounting, and sorting; final sorting and packing of case histories for long-term storage are carried out. 3. Medical and statistical analysis of medical institutions Analysis of the activities of health facilities is carried out according to the annual report on the basis of state statistical reporting forms. The statistical data of the annual report are used to analyze and evaluate the activities of the health facility as a whole, its structural divisions, assess the quality of medical care and preventive measures. The annual report (f. 30 "Report of the medical institution") is compiled on the basis of the data of the current accounting of the elements of the work of the institution and the forms of primary medical documentation. The report form is approved by the Central Statistical Bureau of the Russian Federation and is the same for all types of institutions. Each of them fills in the part of the report that relates to its activities. Features of medical care for individual contingents (children, pregnant women and women in childbirth, patients with tuberculosis, malignant neoplasms, etc.) are given in annexes to the main report in the form of insert reports (there are 12 of them). In the summary tables of reporting forms 30, 12, 14, information is given in absolute terms, which are of little use for comparison and completely unsuitable for analysis, evaluation and conclusions. Thus, absolute values are needed only as initial data for calculating relative values (indicators), according to which statistical and economic analysis of the activities of a medical institution is carried out. Their reliability is influenced by the type and method of observation and the accuracy of absolute values, which depends on the quality of registration of accounting documents. When developing primary documentation, various indicators are calculated that are used in the analysis and evaluation of the institution's activities. The value of any indicator depends on many factors and causes and is associated with various performance indicators. Therefore, when evaluating the activities of the institution as a whole, one should keep in mind the various influences of various factors on the results of the work of health care institutions and the range of the relationship between performance indicators. The essence of the analysis lies in assessing the value of the indicator, comparing and comparing it in dynamics with other objects and groups of observations, in determining the relationship between indicators, their dependence on various factors and causes, in interpreting data and conclusions. The performance indicators of health care facilities are evaluated based on comparison with norms, standards, official guidelines, optimal and achieved indicators, comparisons with other institutions, teams, aggregates in dynamics by years, months of the year, days, followed by determination of work efficiency. In the analysis, indicators are combined into groups that characterize a particular function of a health facility, a section of work, a division or a serviced contingent. The generalized scheme of analysis includes the following sections. 1. General characteristics. 2. Organization of work. 3. Specific performance indicators. 4. Quality of medical care. 5. Continuity in the work of institutions. The annual report of the joint hospital consists of the following main sections: 1) general characteristics of the institution; 2) states; 3) activities of the polyclinic; 4) operation of the hospital; 5) activities of paraclinical services; 6) sanitary and educational work. An economic analysis of the activities of health facilities in the context of insurance medicine should be carried out in parallel in the following main areas: 1) use of fixed assets; 2) use of the bed fund; 3) use of medical equipment; 4) the use of medical and other personnel (see "Economics of health care"). Below is a methodology for analyzing the activities of health care facilities using the example of an integrated hospital, but this scheme can be used to analyze the work of any medical institution. 4. Methodology for analyzing the annual report of the joint hospital Based on the reporting data, indicators are calculated that characterize the work of the institution, according to which the analysis of each section of the work is carried out. Using the data obtained, the head physician of the institution writes an explanatory note in which he gives a complete and detailed analysis of all indicators and activities of the institution as a whole. Section 1. General characteristics of the hospital and its area of activity The general description of the hospital is given on the basis of the passport part of the report, which indicates the structure of the hospital, its capacity and category (Table 10), lists the medical and auxiliary and diagnostic services included in it, the number of medical sites (therapeutic, shop, etc.) , equipment of the institution. Knowing the number of the population served by the polyclinic, it is possible to calculate the average number of the population in one area and compare it with the calculated standards. Table 10 Capacity and category of hospital and polyclinic  Section 2. Hospital States The "States" section indicates the states of the polyclinic and hospital, the number of occupied positions of doctors, middle and junior medical personnel. According to the report table (f. 30), absolute values in the columns of the report "States", "Employed", "Individuals" are considered as initial data. The column of the reporting form No. 30 "States" is controlled and must correspond to the staffing table; the column "Employed" during the control must correspond to the payroll; in the column "Individuals" the absolute number of individuals must correspond to the number of work books of employees of the institution in the personnel department. In the "States" column, the numbers can be greater than in the "Employed" column, or equal to them. "Employed" should never exceed the number of full-time positions. Staffing with doctors (by positions and individuals): number of occupied medical positions (individuals) x 100 / number of full-time medical positions (normally (N) = 93,5). Staffing with paramedical personnel (by positions and individuals): number of occupied positions (individuals) of nursing staff x 100 / number of staff positions of nursing staff (N= 100%). Staffing of junior medical personnel (by positions and individuals): number of occupied positions (individuals) of junior medical staff x 100 / number of full-time positions of junior medical staff. Compatibility coefficient (CS): the number of occupied medical positions / the number of physical. persons in positions. Example: the number of occupied medical positions - 18, the number of physical. persons in occupied positions - 10 K.S. \u18d 10 / 1,8 \uXNUMXd XNUMX. The optimal indicator should be equal to one, the higher it is, the lower the quality of medical care. Section 3. Activities of the polyclinic A comprehensive analysis and objective assessment of the work of the polyclinic are the basis for effective management of its activities, making optimal management decisions, timely control, clear, targeted planning and, ultimately, an effective means of improving the quality of medical support for attached contingents. The activities of the polyclinic are analyzed in the following main areas: 1) analysis of the staffing of the polyclinic, the state of its material and technical base and the provision of medical equipment, the compliance of the organizational and staffing structure of its divisions with the volume and nature of the tasks to be solved; 2) state of health, morbidity, hospitalization, labor losses, mortality; 3) dispensary work, the effectiveness of ongoing medical and recreational activities; 4) medical and diagnostic work in the following sections: a) medical work of departments of therapeutic and surgical profile; b) the work of the hospital department (day hospital); c) the work of diagnostic units; d) the work of auxiliary medical departments and polyclinic rooms (physiotherapy department, exercise therapy rooms, reflexology, manual therapy, etc.); e) organization and condition of emergency medical care and home care, preparation of patients for planned hospitalization; f) organization of rehabilitation treatment; g) defects in the provision of medical care at the prehospital stage, the reasons for discrepancies in diagnoses between the clinic and the hospital; 5) organization and conduct of a consultative and expert commission and medical and social expertise; 6) preventive work; 7) financial, economic and economic work. The analysis is based on an objective and complete accounting of all the work carried out in the clinic and compliance with established methods for calculating indicators, which ensures reliable and comparable results. An essential element of the analysis is to identify the dynamics (positive or negative) of the indicators and the reasons that led to its change. The scope of the analysis of the work of the clinic is set depending on its frequency. The most profound and comprehensive analysis is carried out during the year when compiling the annual medical report and an explanatory note to it. In the period between annual reports, an interim analysis is carried out on a quarterly basis with a cumulative total. Operational analysis, reflecting the main issues of the polyclinic, should be performed daily, weekly and monthly. Such periodicity allows the management of the clinic to know the state of work in the clinic and to correct it in a timely manner. In the course of the analysis, both positive results and shortcomings are determined, their assessment is given, the necessary measures are outlined to eliminate shortcomings and improve the work of the polyclinic. Analysis of the work of the polyclinic for a month, quarter, half a year and nine months is carried out in the same areas of activity of the polyclinic. Additionally, the implementation of therapeutic and preventive measures for contingents attached to medical support to the clinic is analyzed. All performance indicators are compared with similar indicators for the corresponding period of the previous year. Analysis of the work of the clinic for the year. All areas of activity of the clinic are analyzed. At the same time, recommendations and methods for calculating medical and statistical indicators are used, which are set out in the guidelines for compiling an annual medical report and an explanatory note to it. In order to draw objective conclusions from the analysis of work for the year, it is necessary to conduct a comparative analysis of the performance of the clinic for the reporting and previous years with the performance of other clinics, with average indicators for the city (region, district). Inside the polyclinic, the performance of departments with similar profiles is compared. Particular attention should be paid to the analysis of the effectiveness of introducing new modern medical technologies into the practice of diagnostics and treatment, including hospital replacements, as well as the implementation of proposals to improve the material and technical base. The degree of fulfillment of the tasks set by the departments of the polyclinic and the institution as a whole is assessed, the correspondence of the forces and means available in the polyclinic to the nature and characteristics of the tasks it solves is reflected. Statistical analysis is carried out according to the scheme: 1) general information about the clinic; 2) organization of work of the polyclinic; 3) preventive work of the polyclinic; 4) quality of medical diagnostics. To calculate the performance indicators of the polyclinic, the source of information is the annual report (f. 30). Provision of the population with polyclinic care is determined by the average number of visits per 1 inhabitant per year: number of medical visits in the polyclinic (at home) / number of population served. In the same way, it is possible to determine the provision of the population with medical care in general and in individual specialties. This indicator is analyzed in dynamics and compared with other polyclinics. The indicator of the load of doctors for 1 hour of work: total number of visits during the year / total number of hours of admission during the year. Estimated workload rates for doctors are presented in Table 11. Table 11 Estimated norms of the function of a medical position with different options for work schedules
Note. The head physician has the right to change the norms reception in the polyclinic and home care, however, the annual planned function of the posts in the whole institution must be fulfilled The function of a medical position (FVD) is the number of visits to one doctor working at the same rate per year. Distinguish FVD actual and planned: 1) The actual FVD is obtained from the amount of visits for the year according to the doctor's diary (f. 039 / y). For example, 5678 visits per year to a therapist; 2) The planned HR should be calculated taking into account the standard workload of a specialist for 1 hour at the reception and at home according to the formula: FVD \u6d (a x 1 x c) + (a1 x b1 x cXNUMX), where (a x b x c) - work at the reception; (a1 x b1 x c1) - work at home; a - the load of the therapist for 1 hour at the reception (5 people per hour); b - number of hours at the reception (3 hours); c - the number of working days of health facilities per year (285); a1 - load for 1 hour at home (2 people); b1 - the number of hours of work at home (3 hours); в1 - the number of working days of health facilities in a year. The degree of implementation of the FVD - this is the percentage of the actual FVD to the planned one: HPF actual x 100 / HPF planned. The value of the actual FVD and the degree of fulfillment are influenced by: 1) the accuracy of registration of the accounting form 039 / y; 2) work experience and qualifications of the doctor; 3) reception conditions (equipment, staffing with medical personnel and paramedical personnel); 4) the need of the population for outpatient care; 5) mode and work schedule of a specialist; 6) the number of days worked by a specialist in a year (may be less due to the doctor's illness, business trips, etc.). This indicator is analyzed for each specialist, taking into account the factors affecting its value (standards for the function of the main medical positions). The function of a medical position depends not so much on the doctor's workload at the reception or at home, but on the number of days worked during the year, employment and staffing of medical positions. Structure of visits by specialties (on the example of a therapist, %). The structure of visits to the polyclinic depends on the staffing of its specialists, their workload and the quality of registration form 039 / y: number of visits to a therapist x 100 / number of visits to doctors of all specialties (in N = 30 - 40%). Thus, for each specialist, the proportion of his visits to the total number of visits to all doctors per year is determined, with an indicator of 95%, specialized medical care was not provided. The share of rural residents in the total number of visits to the polyclinic (%): number of visits to polyclinic doctors by rural residents x 100 / total number of visits to the polyclinic. This indicator is calculated both for the clinic as a whole and for individual specialists. Its reliability depends on the quality of filling in the primary accounting documentation (f. 039 / y). Structure of visits by types of applications (on the example of a therapist,%): 1) the structure of visits for diseases: number of visits to a specialist for diseases x 100 / / total number of visits to this specialist; 2) the structure of visits for medical examinations: number of visits for preventive examinations x 100 / total number of visits to this specialist. This indicator makes it possible to see the main direction in the work of doctors of certain specialties. The ratio of preventive visits for diseases to individual doctors is compared with their workload and employment in time during the month. With properly organized work, visits for diseases to therapists make up 60%, to surgeons - 70 - 80%, to obstetrician-gynecologists - 30 - 40%. Home visiting activity (%): number of home doctor visits made actively x 100 / total number of home doctor visits. The indicator of activity, depending on the ratio of primary and repeated visits, the number of which is determined by the dynamics and nature of diseases (severity, seasonality), as well as the possibility of hospitalization, ranges from 30 to 60%. When analyzing the indicator calculated using the above formula, it should be borne in mind that it characterizes the volume of active visits to patients at home (an active visit should be understood as a visit made on the initiative of a doctor). For a more accurate characterization of the activity of this type of visits, it is necessary to differentiate between primary and repeated visits and calculate this indicator only in relation to repeated visits, which makes it possible to conduct an in-depth analysis based on the data contained in the Book of Calling Doctors at Home (f. 031 / y ). It is advisable to calculate this indicator in relation to patients with pathology requiring active monitoring (croupous pneumonia, hypertension, etc.). It indicates the degree of attention of doctors to patients. The reliability of this indicator depends both on the quality of keeping records of active visits in the registration form 039 / y and the staffing of doctors, and on the structure of diseases at the site. With proper organization of work, its value ranges from 85 to 90%. District public services One of the main forms of polyclinic services for the population is the territorial-district principle in the provision of medical care to the population. The reliability of the indicators characterizing the district service to the population, to a large extent, depends on the quality of the design of the doctor's diary (f. 039 / y). The average population in the area (therapeutic, pediatric, obstetric-gynecological, workshop, etc.): average annual adult population assigned to the polyclinic / number of sites (eg therapeutic) in the polyclinic. Currently, one territorial therapeutic site in the Russian Federation accounts for an average of 1700 people of the adult population, for pediatrics - 800 children, for obstetrics and gynecology - about 3000 women (of which 2000 women of childbearing age), for a workshop - 1500 - 2000 workers. Service rates for doctors in outpatient clinics are shown in Table 12. Table 12 Estimated service rates for doctors of outpatient clinics
The rate of visits to a district doctor at an appointment in a polyclinic (%) is one of the leading indicators: number of visits to the local doctor by residents of their area x 100 / total number of visits to the local doctors during the year. The indicator of the locality at the reception characterizes the organization of the work of doctors in the polyclinic and indicates the degree of compliance with the district principle of providing medical care to the population, one of the advantages of which is that patients in the district should be served by one, "their" doctor ("their" doctor should be considered a district therapist in the event that he constantly works at the site or replaces another doctor for at least 1 month). From this point of view, the indicator of division, with the correct organization of work, equal to 80 - 85%, can be considered optimal. It practically cannot reach 100%, because due to the absence of their district doctor for objective reasons, residents of this district visit other doctors. At a lower indicator, one should look for the causes and factors that influence it (inconvenient for the population, the schedule of admission, the absence of a doctor, etc.). Home care coverage: number of home visits made by your GP x 100 / total number of home visits. With reliable registration f. 039 / for this indicator, as a rule, is high and reaches 90 - 95% with sufficient staffing. To analyze the state of medical care at home in order to correct it during the year, it can be calculated for individual district doctors and for months. With a decrease in district coverage below 50 - 60%, one can make an assumption about a low level of work organization or understaffing, which negatively affects the quality of outpatient services for the population. Compliance with the district largely depends on the accurate work of the registry, the ability to correctly distribute patients, correctly draw up a schedule for the work of doctors, and the population in the area. Using the data contained in the doctor's diary (f. 039 / y), you can determine repetition of outpatient visits: number of return visits to doctors / number of initial visits to the same doctors. If this indicator is high (5 - 6%), one can think about the groundlessness of repeated visits prescribed by doctors due to an insufficiently thoughtful attitude towards patients; a very low rate (1,2 - 1,5%) indicates insufficiently qualified medical care in the clinic and that the main goal of repeated visits to patients is to mark a disability certificate. Dispensary services for the population The source of information on periodic inspections is the "Map subject to periodic inspection" (f. 046 / y). To assess the preventive work of the clinic, the following indicators are calculated. Completeness of coverage of the population with preventive examinations(%): number actually inspected x 100 / number to be inspected according to the plan. This indicator is calculated for all contingents (f. 30-zdrav, section 2, subsection 5 "Prophylactic examinations carried out by this institution). The indicator is usually high and approaches 100%. Frequency of detected diseases ("pathological lesion") is calculated for all diagnoses that are indicated in the report for 100, 1000 examined: number of diseases detected during professional examinations x 1000 / total number of examined persons. This indicator reflects the quality of preventive examinations and indicates how often the identified pathology occurs in the “environment” of those examined or in the “environment” of the population of the area where the polyclinic operates. More detailed results of preventive examinations can be obtained by developing "Dispensary observation cards" (f. 030 / y). This allows you to examine this contingent of patients by sex, age, profession, length of service, duration of observation; in addition, to evaluate the participation in examinations of doctors of various specialties, the performance of the required number of examinations per person, the effectiveness of examinations and the nature of the measures taken to improve and examine these contingents. To obtain a reliable indicator, it is important to timely correctly issue statistical coupons at professional examinations (f. 025-2 / y). The quality of examinations depends on the detection of pathology and its timely registration in accounting and reporting documents. Per 1000 examined, the frequency of detection of hypertension is 15, chronic bronchitis - 13, thyrotoxicosis - 5, rheumatism - 2. Dispensary observation of patients For the analysis of dispensary work, three groups of indicators are used: 1) dispensary observation coverage indicators; 2) indicators of the quality of dispensary observation; 3) indicators of the effectiveness of dispensary observation. The data necessary to calculate these indicators can be obtained from accounting and reporting documents (f. 12, 030 / y, 025 / y, 025-2 / y). Dispensary observation coverage indicators are as follows. In this group, indicators of the frequency and structure of coverage by dispensary observation ("D" observation) are singled out. 1. Frequency indicators. Coverage of the population by medical examination (per 1000 inhabitants): is on "D"-observation during the year x 1000 / total population served. The structure of patients under "D"-observation, according to nosological forms (%): the number of patients under "D"-observation for this disease x 100 / total number of dispensary patients. 2. Indicators of the quality of clinical examination. Timeliness of taking patients on "D"-account (%) (for all diagnoses): number of patients newly diagnosed and taken under "D"-observation x 100 / total number of newly diagnosed patients. The indicator characterizes the work on early taking on the "D"-registration, therefore it is calculated from the totality of diseases with a diagnosis established for the first time in life according to individual nosological forms. With proper organization of work, this figure should approach 100%: hypertension - 35%, peptic ulcer - 24%, coronary artery disease - 19%, diabetes mellitus - 14,5%, rheumatism - 6,5%. Completeness of coverage by "D"-observation of patients (%): number of patients on "D"-registration at the beginning of the year + newly taken under "D"-observation - never appeared x 100 / number of registered patients requiring "D"-registration. This indicator characterizes the activity of doctors in the organization and conduct of medical examinations and should be 90 - 100%. It can be calculated both in relation to the entire dispensary contingent of patients, and separately for those nosological forms, information about which is available in the report. Frequency of visits: number of visits to the doctor made by patients of the dispensary group / number of persons in the dispensary group. Compliance with the terms of dispensary examinations (scheduled observation), %: the number of prophylactic patients who observed the terms of appearance for "D"-observation x 100 / total number of prophylactic patients. The percentage of "come off" (never came to the doctor for a year) is normally acceptable from 1,5 to 3%. Completeness of medical and recreational activities (%): underwent this type of treatment (recovery) x 100 / needed this type of treatment (recovery) during the year. Indicators of the effectiveness of dispensary observation The effectiveness of dispensary observation is assessed by indicators that characterize the achievement of the goal of medical examination, its final results. It depends not only on the efforts and qualifications of the doctor, the level of organization of dispensary observation, the quality of medical and recreational activities, but also on the patient himself, his material and living conditions, working conditions, socio-economic and environmental factors. It is possible to evaluate the effectiveness of clinical examination based on the study of the completeness of the examination, the regularity of observation, the implementation of a complex of medical and recreational activities and its results. This requires an in-depth analysis of the data contained in the "Medical record of the outpatient" (f. 025 / y) and the "Control card for dispensary observation" (f. 030 / y). The main criteria for the effectiveness of prophylactic medical examinations are shifts in the state of health of patients (improvement, deterioration, no change), the presence or absence of relapses, indicators of disability, a decrease in morbidity and mortality in the dispensary group, as well as access to disability and the results of rehabilitation and re-examination of disabled people who are "D" - account. To assess these changes for each patient, once a year, a so-called milestone epicrisis is compiled, which is recorded in the "Medical record of the outpatient". In a milestone epicrisis, the patient's subjective state, objective examination data, therapeutic and preventive measures taken, as well as employment measures are briefly recorded. It is recommended to evaluate the effectiveness of clinical examination in dynamics for 3-5 years. Evaluation of the effectiveness of clinical examination should be carried out separately by groups: 1) healthy; 2) persons who have had acute illnesses; 3) patients with chronic diseases. The criteria for the effectiveness of prophylactic medical examination of healthy people (I group "D"-observations) are the absence of diseases, the preservation of health and ability to work, that is, the absence of transfer to the group of patients. The criteria for the effectiveness of prophylactic medical examination of persons who have had acute illnesses (Group II "D"-observation) are complete recovery and transfer to the healthy group. The indicators characterizing the effectiveness of medical examination of chronic patients are as follows. The proportion of patients removed from the "D"-registration in connection with recovery: the number of persons removed from the "D"-registration in connection with recovery x 100 / the number of patients on the "D"-registration. The proportion of patients removed from the "D"-registration in connection with recovery, is normally acceptable for hypertension - 1%, peptic ulcer - 3%, rheumatism - 2%. The proportion of patients removed from the "D"-registration due to death (for all diagnoses): the number of patients removed from the "D"-registration due to death x 100 / the number of patients on the "D"-registration. The proportion of relapses in the dispensary group: the number of exacerbations (relapses) in the dispensary group x 100 / the number of people with this disease undergoing treatment. This indicator is calculated and analyzed for each nosological form separately. The proportion of patients on "D"-observation who did not have temporary disability during the year (VUT): the number of patients in the dispensary group who did not have TD during the year x 100 / the number of employees in the dispensary group. The proportion of newly taken on the "D"-registration among those under observation: the number of newly taken patients on the "D"-registration with this disease x 100 / the number of patients on the "D"-registration at the beginning of the year + newly taken patients in this year. This indicator gives an idea of the systematic work on clinical examination in the clinic. It should not be high, otherwise it will indicate a decrease in the quality of detection of a particular pathology in previous years. If the indicator is above 50%, we can conclude that there is insufficient work on medical examination. It is recommended to analyze this indicator for individual nosological forms, since in long-term diseases it is less than 30%, and in rapidly curable diseases it can be much higher. Morbidity with temporary disability (TS) in cases and days for specific diseases, for which patients are taken to the "D"-registration (per 100 medical examinations): the number of cases (days) of morbidity with VUT with a given disease among those who were prophylactic in a given year x 100 / the number of prophylactic patients with this disease. The effectiveness of clinical examination is confirmed by a decrease in the value of this indicator when compared with the indicator for the previous year (or several years). The indicator of primary disability consisting on the "D"-registration for the year (per 10 medical examinations): recognized as disabled for the first time in a given year for this disease out of those on the "D"-registration x 1000 / the number of those on the "D"-registration during the year for this disease. Mortality among patients on the "D"-registration (per 100 medical examinations): the number of deaths among those on the "D"-registration x 1000 / the total number of persons on the "D"-registration. The average number of patients registered at the dispensary in the therapeutic area: it is considered optimal when the district doctor is registered with 100-150 patients with various diseases. Statistical indicators of incidence General frequency (level) of primary morbidity (‰): number of all initial applications x 1000 / average annual number of attached population. Frequency (level) of primary morbidity by classes (groups, separate forms) of diseases (‰): number of initial visits for diseases x 1000 / average annual attached population. The structure of primary morbidity by classes (groups, separate forms) of diseases (%): number of initial visits for diseases x 100 / number of initial visits for all classes of diseases. Statistical indicators of labor losses Overall frequency of cases (days) of labor loss (‰): the number of all cases (or days) of labor loss x 1000 / the average annual number of the attached population. Frequency of cases (days) of labor losses by classes (groups, separate forms) of diseases (‰): number of cases (days) of labor loss due to all diseases x 1000 / average annual number of attached population. Structure of cases (days) of labor losses by classes (groups, individual forms) of diseases (%): number of cases (days) of labor losses by classes (groups, separate forms) of diseases x 100 / number of cases (or days) of labor losses by all classes of diseases. Average duration of cases of labor loss by classes (groups, separate forms) of diseases (days): the number of days of labor loss by classes (groups, separate forms) of diseases / the number of cases of labor loss due to skin diseases (trauma, influenza, etc.). Day hospital performance indicators The structure of patients treated in the day hospital by class (groups, individual forms of diseases) (%): number of patients treated by classes (groups, separate forms) of diseases x 100 / total number of patients treated in a day hospital. The average duration of treatment of patients in a day hospital (days): number of treatment days spent in the day hospital by all treated patients / total number of patients treated in the day hospital. The average duration of treatment in a day hospital by classes (groups, separate forms) of diseases (days): number of days of treatment of patients in a day hospital by classes (groups, separate forms) of diseases / number of patients treated in a day hospital, by classes (groups, separate forms) of diseases. Number of days of treatment in a day hospital per 1000 attached population (‰): number of hospital days x 1000 / total attached population. Hospitalization rates Overall frequency (level) of hospitalization (‰): number of all hospitalized patients x 1000 / average annual fixed population. Frequency (level) of hospitalization by classes (groups, individual forms) of diseases (‰): number of hospitalized by classes (groups, individual forms) of diseases x 1000 / average annual number of attached population. The structure of hospitalization by classes (groups, separate forms) of diseases (%): number of hospitalized by classes (groups, separate forms) of diseases x 100 / number of all hospitalized. Section 4. Operation of the hospital Statistical data on the operation of the hospital are presented in the annual report (form 30-zdrav.) in Section 3 "Beds and its use" and in the "Report on the activities of the hospital for the year" (form 14). These data make it possible to determine the indicators necessary to assess the use of hospital beds and the quality of treatment. However, the assessment of hospital performance should not be limited to these sections of the report. A detailed analysis is possible only when using, studying and correctly filling out the primary accounting documentation: 1) a medical card of an inpatient (f. 003 / y); 2) a journal for registering the movement of patients and hospital beds (f. 001 / y); 3) a consolidated monthly record of the movement of patients and bed capacity in a hospital (department, bed profile) (f. 016 / y); 4) a statistical card of the person who left the hospital (f. 066 / y). The assessment of the work of the hospital is given on the basis of the analysis of two groups of indicators: 1) bed fund and its use; 2) the quality of medical and diagnostic work. Use of hospital beds Rational use of the actually deployed bed fund (in the absence of overload) and compliance with the required period of treatment in departments, taking into account the specialization of beds, diagnosis, severity of pathology, concomitant diseases, are of great importance in organizing the work of a hospital. To assess the use of the bed fund, the following most important indicators are calculated: 1) provision of the population with hospital beds; 2) average annual hospital bed occupancy; 3) the degree of use of the bed fund; 4) turnover of a hospital bed; 5) the average duration of the patient's stay in bed. Provision of the population with hospital beds (per 10 population): total hospital beds x 10 / population served. Average annual employment (work) of a hospital bed: number of bed days actually spent by patients in the hospital / average annual number of beds. Average annual number of hospital beds is defined as follows: number of actually occupied beds per month of the year in hospital / 12 months. This indicator can be calculated both for the hospital as a whole and for departments. Its assessment is made by comparison with the calculated standards for departments of various profiles. Analyzing this indicator, it should be taken into account that the number of actually spent hospital days includes days spent by patients on the so-called side beds, which are not counted among the average annual beds; Therefore, the average annual bed occupancy may be more than the number of days in a year (over 365 days). The work of a bed less or more than the standard indicates, respectively, an underload or an overload of the hospital. Approximately this figure is 320 - 340 days a year for city hospitals. Degree of use of beds (fulfillment of the plan for bed days): number of actual hospital days spent by patients x 100 / planned number of hospital days. The planned number of bed days per year is determined by multiplying the average annual number of beds by the bed occupancy rate per year (Table 13). Table 13 Average number of days of use (occupancy) of a bed per year
This indicator is calculated for the hospital as a whole and for departments. If the average annual bed occupancy is within the norm, then it approaches 30%; if the hospital is overloaded or underloaded, the indicator will be respectively higher or lower than 100%. Hospital bed turnover: number of discharged patients (discharged + deceased) / average annual number of beds. This indicator indicates how many patients were "served" by one bed during the year. The speed of bed turnover depends on the duration of hospitalization, which, in turn, is determined by the nature and course of the disease. At the same time, a decrease in the length of stay of a patient in a bed and, consequently, an increase in the turnover of a bed largely depend on the quality of diagnosis, the timeliness of hospitalization, care and treatment in the hospital. The calculation of the indicator and its analysis should be carried out both for the hospital as a whole and for departments, bed profiles, and nosological forms. In accordance with the planned standards for city hospitals of a general type, the bed turnover is considered optimal in the range of 25-30, and for dispensaries - 8-10 patients per year. Average length of stay of a patient in a hospital (average bed day): the number of hospital days spent by patients per year / the number of discharged patients (discharged + deceased). Like the previous indicators, it is calculated both for the hospital as a whole and for departments, bed profiles, and individual diseases. Tentatively, the standard for general hospitals is 14-17 days, taking into account the profile of beds, it is much higher (up to 180 days) (Table 14). Table 14 Average number of days a patient stays in bed  The average bed-day characterizes the organization and quality of the treatment and diagnostic process, indicates the reserves for increasing the use of the bed fund. According to statistics, reducing the average length of stay in bed by only one day would allow more than 3 million additional patients to be hospitalized. The value of this indicator largely depends on the type and profile of the hospital, the organization of its work, the quality of treatment, etc. One of the reasons for the long stay of patients in the hospital is insufficient examination and treatment in the clinic. Reducing the duration of hospitalization, freeing up additional beds, should be carried out primarily taking into account the condition of patients, since premature discharge can lead to re-hospitalization, which ultimately will not reduce, but increase the indicator. A significant decrease in the average hospital stay compared to the standard may indicate insufficient justification for reducing the duration of hospitalization. The proportion of rural residents among hospitalized patients (Section 3, subsection 1): the number of rural residents hospitalized in a hospital for the year x 100 / the number of all admitted to the hospital. This indicator characterizes the use of beds in a city hospital by rural residents and affects the indicator of provision of the rural population of a given territory with inpatient medical care. In city hospitals it is 15 - 30%. The quality of the medical and diagnostic work of the hospital To assess the quality of diagnosis and treatment in a hospital, the following indicators are used: 1) the composition of patients in the hospital; 2) the average duration of treatment of a patient in a hospital; 3) hospital mortality; 4) quality of medical diagnostics. The composition of patients in the hospital for certain diseases (%): the number of patients who left the hospital with a specific diagnosis x 100 / the number of all patients who left the hospital. This indicator is not a direct characteristic of the quality of treatment, but the indicators of this quality are associated with it. Calculated separately for departments. The average duration of treatment of a patient in a hospital (for individual diseases): number of hospital days spent by discharged patients with a certain diagnosis / number of discharged patients with a given diagnosis. To calculate this indicator, in contrast to the indicator of the average length of stay of a patient in a hospital, not discharged (discharged + deceased) patients are used, but only discharged, and it is calculated by disease separately for discharged and deceased patients. There are no standards for the average duration of treatment, and when assessing this indicator for a given hospital, it is compared with the average duration of treatment for various diseases that have developed in a given city or district. When analyzing this indicator, the average duration of treatment of patients transferred from department to department, as well as those re-admitted to the hospital for examination or follow-up care, is considered separately; for surgical patients, the duration of treatment before and after surgery is calculated separately. When evaluating this indicator, it is necessary to take into account various factors that affect its value: the timing of the examination of the patient, the timeliness of diagnosis, the appointment of effective treatment, the presence of complications, the correctness of the examination of working capacity. A number of organizational issues are also of great importance, in particular, the provision of the population with inpatient care and the level of outpatient care (selection and examination of patients for hospitalization, the ability to continue treatment after discharge from the hospital in the clinic). The assessment of this indicator presents significant difficulties, since its value is influenced by many factors that do not directly depend on the quality of treatment (cases started at the prehospital stage, irreversible processes, etc.). The level of this indicator to a large extent also depends on the age, sex composition of patients, the severity of the disease, the duration of hospitalization, and the level of pre-hospital treatment. This information, necessary for a more detailed analysis of the average duration of a patient's treatment in a hospital, is not contained in the annual report; they can be obtained from primary medical documents: "Medical record of an inpatient" (f. 003 / y) and "Statistical card of a person who left the hospital" (f. 066 / y). Hospital mortality (per 100 patients, %): number of deceased patients x 100 / number of discharged patients (discharged + deceased). This indicator is one of the most important and frequently used to assess the quality and effectiveness of treatment. It is calculated both for the hospital as a whole and separately for departments and nosological forms. Daily lethality (per 100 patients, intensive rate): the number of deaths before 24 hours of hospital stay x 100 / the number of those admitted to the hospital. The formula can be calculated like this: share of all deaths on the first day in the total number of deaths (extensive indicator): number of deaths before 24 hours of hospital stay x 100 / number of all deaths in hospital. Death on the first day indicates the severity of the disease and, therefore, the special responsibility of medical personnel in relation to the correct organization of emergency care. Both indicators complement the characteristics of the organization and quality of treatment of patients. In an integrated hospital, in-hospital mortality rates cannot be considered in isolation from home-based mortality, as selection for hospitalization and pre-hospital mortality can have a large impact on in-hospital mortality, reducing or increasing it. In particular, low hospital mortality with a large proportion of deaths at home may indicate defects in referral to a hospital, when seriously ill patients were denied hospitalization due to a lack of beds or for some other reason. In addition to the indicators listed above, indicators characterizing the activities of the surgical hospital are also calculated separately. These include the following: The structure of surgical interventions (%): number of patients operated on for this disease x 100 / total number of operated patients for all diseases. Postoperative mortality (per 100 patients): number of patients who died after surgery x 100 / number of operated patients. It is calculated as a whole for the hospital and for individual diseases requiring emergency surgical care. The frequency of complications during operations (per 100 patients): number of operations in which complications were observed x 100 / number of operated patients. When evaluating this indicator, it is necessary to take into account not only the level of frequency of complications during various operations, but also the types of complications, information about which can be obtained during the development of "Statistical cards of the patient who left the hospital" (f. 066 / y). This indicator should be analyzed together with the duration of hospital treatment and mortality (both general and postoperative). The quality of emergency surgical care is determined by the speed of admission of patients to the hospital after the onset of the disease and the timing of operations after admission, measured in hours. The higher the percentage of patients admitted to the hospital in the first hours (up to 6 hours from the onset of the disease), the better the ambulance and emergency care and the higher the quality of the diagnosis of district doctors. Cases of delivery of patients later than 24 hours from the onset of the disease should be considered as a big drawback in the organization of the work of the clinic, since the timeliness of hospitalization and surgical intervention is crucial for a successful outcome and recovery of patients in need of emergency care. The quality of medical diagnostics in the clinic and hospital One of the most important tasks of the doctor is to make an early correct diagnosis, allowing timely initiation of appropriate treatment. The causes of misdiagnosis are diverse, and their analysis can improve the quality of diagnosis, treatment, and the effectiveness of medical care. The quality of medical diagnostics is considered on the basis of the coincidence or discrepancy between the diagnoses made by the doctors of the polyclinic and the hospital or the doctors of the hospital and pathologists. To assess the quality of medical diagnosis in medical statistics, a more accurate interpretation of the concept of "incorrect diagnosis" is used: 1) misdiagnosis; 2) diagnoses that are not confirmed; when corrected, they reduce the total number of cases of a given disease; 3) diagnosed diagnoses - diagnoses that are established in a hospital against the background of other diseases; they increase the total number of cases of a given disease; 4) incorrect diagnoses - the sum of erroneous and overlooked diagnoses for a particular disease; 5) matched diagnoses for all diseases - the sum of diagnoses that matched in the hospital with those established in the clinic; 6) mismatched diagnoses - the difference between the total number of hospitalized patients and patients in whom the hospital diagnosis coincided with the outpatient diagnosis. The assessment of the quality of medical diagnostics in the clinic is carried out by comparing the diagnoses of patients made when they were sent for hospitalization with the diagnoses established in the hospital. The reporting data does not contain information on this issue, therefore the source of information is the "Statistical card of the person who left the hospital" (f. 066 / y). As a result of comparison of the received data, proportion of incorrect diagnoses: the number of polyclinic diagnoses that were not confirmed in the hospital x 100 / the total number of patients referred for hospitalization with this diagnosis. This indicator serves as the basis for a more detailed analysis of errors in the diagnosis of patients referred for inpatient treatment, which may be due to both difficulties in differential diagnosis and gross miscalculations by polyclinic doctors. The assessment of the quality of medical diagnostics in a hospital is carried out on the basis of a comparison of clinical (lifetime) and pathoanatomical (sectional) diagnoses. The source of information in this case is the "Medical records of a hospital patient" (f. 003 / y) and the results of autopsies of the dead. The indicator of coincidence (discrepancy) of diagnoses (%): number of diagnoses confirmed (not confirmed) at autopsy x 100 / total number of autopsies for this cause. The indicator of coincidence of clinical diagnoses with pathoanatomical diagnoses can be calculated from the data of the annual report (Section "Autopsy of the dead in the hospital") for individual diseases. The discrepancy between clinical and pathoanatomical diagnoses of the underlying disease is about 10%. This indicator is also calculated for individual nosological forms that caused death; in this case, it is necessary to take into account erroneous diagnoses and overlooked diagnoses. The reasons for the discrepancy between clinical and pathoanatomical diagnoses can be divided into two groups. 1. Defects in medical work: 1) brevity of observation of the patient; 2) incompleteness and inaccuracy of the survey; 3) underestimation and overestimation of anamnestic data; 4) lack of necessary X-ray and laboratory studies; 5) absence, underestimation or overestimation of the consultant's opinion. 2. Organizational defects in the work of the clinic and hospital: 1) late hospitalization of the patient; 2) insufficient staffing of medical and nursing staff of medical and diagnostic departments; 3) shortcomings in the work of certain services of the hospital (admission department, diagnostic rooms, etc.); 4) incorrect, careless record keeping. A detailed analysis of the discrepancies between clinical and anatomical diagnoses in terms of views and errors is possible only on the basis of a special development of the "Statistical Cards of the Discharged from the Hospital" (f. 066 / y), as well as epicrises filled in for deceased patients. The analysis of the epicrises of the dead is far from being exhausted by comparing the diagnoses - intravital and pathoanatomical. Even with complete coincidence of diagnoses, it is necessary to assess the timeliness of the intravital diagnosis. In this case, it may turn out that the correct final diagnosis is only the last stage of many incorrect, mutually exclusive diagnostic assumptions of the doctor during the entire period of observation of the patient. If the intravital diagnosis is made correctly, then it is necessary to find out whether there were any defects in the treatment that would be directly or indirectly related to the death of the patient. Clinical and anatomical conferences are periodically organized to compare clinical and pathoanatomical diagnoses and analyze the epicrises of the deceased in the hospital, with the analysis of each case of discrepancies in diagnoses, which contributes to the improvement of diagnosis, proper treatment and monitoring of patients. Quantitative indicators (coefficients) characterizing the ILC based on the results of the examination and questioning 1. Integral intensity factor (TOи) is the derivative of the coefficients of medical effectiveness (Kр), social satisfaction (Kс), volume of work performed (Kabout) and cost ratio (Kз): Ки = Kр x Kс x Kabout x Kз At the first stages of work, due to possible difficulties in conducting economic calculations, when determining Kz, one can limit oneself to three coefficients Ки = Kр x Kс x Kabout. 2. Medical success rate (TOр) - the ratio of the number of cases with an achieved medical result (Рд) to the total number of assessed cases of medical care (P): If the K level is also taken into accountрthen Кр = ΣPi 3 toi / R, where Σ is the summation sign; Рi - the level of the result obtained (complete recovery, improvement, etc.); ai - scoring the level of the result obtained (complete cure - 5 points, partial improvement - 4 points, no change - 3 points, significant deterioration - 1 point). This coefficient can also be considered as a quality coefficient (Kk): Кк = number of cases of full compliance with adequate technologies / total number of cases of medical care assessed, and also as indicators of the structure of the reasons for the wrong choice of technology or their non-compliance. Kp for the institution as a whole is defined as the quotient of the relevant indicators (Pd and P) for the treatment units. 3. Social Satisfaction Ratio (TOс) - the ratio of the number of cases of customer (patient, staff) satisfaction (Y) to the total number of assessed cases of medical care (N). Кс = U / N If satisfaction is also taken into account, then Кр = ΣУi x ai / R, wherei - the number of respondents who answered positively to the i-th question (completely satisfied, not satisfied, etc.); аi - scoring of the level of the result obtained. When determining this coefficient, only information about the satisfaction of patients with the medical care provided to them is taken into account. Provided that in all points of the questionnaire it is noted "I find it difficult to answer", then such a questionnaire is not included in the calculation. If at least one of the points has a negative assessment of the patient, it should be considered dissatisfied with the assistance provided. Kc for the medical institution as a whole is defined as the quotient of the corresponding indicators for the medical units of the institution. 4. Work done ratio (TOabout) is one of the most important performance indicators of a medical institution and its divisions. Кabout = Oф / Oп, where Oф - the number of actually performed medical services; Оп - the number of planned medical services. As indicators characterizing the activities of an institution or its divisions, for calculating Kabout the number of completed cases of outpatient or inpatient treatment, studies performed, etc. can be used. When analyzing the volume of work of institutions, it is not recommended to use the “number of visits” as volumetric indicators, since some doctors can improve this indicator due to unreasonable appointment of visits. 5. Individual load factor (TOin) - takes into account the number of patients in comparison with the standard for the position of a doctor of the corresponding clinical profile and category of curation (operation) complexity: Кin = Hф x 100 / Nн, where Hф - an indicator of the actual load, Нн - an indicator of the standard load. This indicator serves to assess the contribution of each individual medical specialist and assess the quality of care provided by him. In the case when the actual number of patients is below the standard for the position of a doctor, a reserve of working time is formed. A doctor can develop a reserve by consulting, on duty, monitoring the ILC and providing other additional services. The head of the medical facility has the right to change the workload of an individual doctor, taking into account the nature of the diseases and the severity of the condition of the patients he is in charge of. In addition, the management of the institution, together with the head of the department, should plan the workload for doctors by type in order to distribute it evenly and meet the standard indicators. 6. Cost ratio (TOз) - the ratio of standard costs (Zн) to the actual incurred costs for the assessed cases of medical care (Zf): Кз = Wн/Zф. 7. Surgical Activity Ratio (TOha) is the ratio of the number of operated patients by a particular doctor (Nop) to the number of patients treated by this doctor (Nл): Кha =Nop / Nл. This indicator serves to evaluate the activities of surgical specialists. 8. In the role of a qualitative criterion for evaluating the activities of nursing staff can be used medical technology compliance ratio (TOArt), which is calculated by the formula: КArt = H - Hд / H, where H is the number of expert assessments; Нд - the number of expert assessments with identified defects in the technology of medical care. When evaluating the value of the indicators obtained, it is recommended to proceed from: 1) a "reference" indicator to which all health workers should strive; 2) the average indicator for the territory (institution, subdivision), by the deviation from which the level of medical care provided by a particular medical worker, subdivision is assessed; 3) the dynamics of this indicator for a particular medical worker, unit, etc. It is advisable to calculate the coefficients on a quarterly basis. They can be calculated in the context of departments, the institution as a whole, individual specialists and nosological forms of interest. An analysis of the activities of a city hospital based on an assessment of the relevant indicators makes it possible to identify shortcomings in the organization of the treatment and diagnostic process, determine the efficiency of the use and reserves of the bed fund, and develop specific measures to improve the quality of medical care for the population. LECTURE No. 4. The economic foundations of health care 1. The effectiveness of health care and its types Health economics is one of the sections of social medicine and healthcare organization, the subjects of which are the study and use of the objective laws of the development of economic relations that develop in the industry in the process of protecting public health. In the conditions of market relations, the economic problems of health care occupy a central place in the activities of health care organizers, economists, and practitioners. The organization of medical care today is based on principles that recognize health as a material value, a resource that has a cost, and medicine itself as a resource-saving productive force of society. For many years there was an opinion that health care belongs to the sphere of non-material production and is manifested by action, and not by the monetary expression of its activity. Indeed, health care refers to the sphere of direct service to the population, which is aimed at improving the indicators of its health; Moreover, by achieving a reduction in morbidity and mortality of the population, improving the physical and mental health of people, increasing life expectancy and economically active longevity, health care contributes to the reproduction of labor resources, which creates prerequisites for increasing labor productivity and increasing national income. Saving personal and social labor, health care directly affects the pace of development of production, increasing labor productivity and reducing the cost of products. Therefore, from these positions, health care activities must be evaluated not only in terms of medical and social efficiency, but also as an economically efficient branch of the national economy. Thus, health care activities bring an economic effect, which can be direct or indirect and manifests itself in the growth of labor productivity, the expansion and development of production and the growth of national income. It is necessary to distinguish between the concepts of "effect" and "efficiency", which are closely related. The effect in health care characterizes the medical, social and economic results of a method, intervention, or event. Efficiency is a broader concept that characterizes the effect and shows how material, labor and financial resources were used in a given method, intervention, event. There are medical, social and economic efficiency. Medical effectiveness is understood as a qualitative and quantitative characteristic of the degree of achievement of the set goals in the field of prevention, diagnosis and treatment of diseases. The term "medical efficiency" is widely used in the study of diagnostic and treatment processes, disease prevention, organization and conduct of medical events. These include, in particular, strengthening the health of children and the elderly, the treatment of certain diseases with a high level of medicine (oncological, AIDS, etc.) and other aspects of medical activity. Social efficiency in its content is very close to medical efficiency. At the same time, if medical efficiency is measured by the result of direct medical intervention, by indicators of improving the health of workers from the onset of the disease to complete recovery with the restoration of working capacity, then the social effectiveness of health care is characterized by an improvement in public health, a decrease in morbidity, premature mortality, a change in demographic indicators, and an ever-increasing satisfaction of the population in medical care and sanitary and epidemiological services. Social efficiency consists in preventing a number of diseases, reducing the number of disabled people and premature deaths, and in improving the quality of medical care as a result of medical and social events. Economic efficiency characterizes the direct and indirect (indirect) contribution made by health care to the growth of labor productivity, the increase in national income, and the development of production. Economic efficiency in health care cannot be a determining criterion; the main thing is the medical and social effectiveness of health protection measures. Often, medical effectiveness is dominant, requiring significant costs, the return on which may take place in the distant future or is completely excluded. When organizing medical care for elderly people with chronic degenerative diseases, patients with mental retardation, severe damage to the central and peripheral nervous system, and some other conditions, with obvious medical and social efficiency, the economic effect will be negative. Thus, the economic efficiency of health care means the rational use of material, labor and financial resources to address issues related to the protection of public health. The economic efficiency of health care creates the following types of economic benefits for the state: reduction of temporary disability, disability, premature death, reduction of medical care costs. The economic aspects of health care do not pursue the goal of reducing health care costs. There should be no cost savings, but a search for ways and methods of their most rational use for the protection of public health. To determine the economic efficiency of health care, economic analysis is used, which consists in comparing the costs and the effect obtained. An economic analysis of the activities of medical institutions is carried out in the following areas: the use of fixed assets, the efficiency of the use of beds and medical equipment, the assessment of financial costs and the cost of various types of medical care, the use of medical and other personnel. Along with this, the main economic indicators are calculated: the total economic damage due to morbidity, disability and mortality, the prevented economic damage and the criterion for the economic efficiency of medical care. In a market economy, the main task of any healthcare facility is to improve the quality and competitiveness of medical services, medicines and medical products in order to obtain maximum economic results. In this regard, economic analysis involves the study of the cost and prices of medical services provided, profitability and profit from their implementation. This will allow assessing the economic activity of a healthcare institution, identifying its internal reserves and correctly choosing priority areas for investing own and borrowed funds. 2. Analysis of the use of fixed assets of a medical institution Fixed assets - a set of material values produced by social labor, operating over a long period. The fixed assets belonging to the institution include buildings and structures, machinery, equipment and inventory. The fixed assets of the national economy represent the most important and rapidly growing part of the national wealth. The main funds are: 1) active part; 2) passive part; 3) other fixed assets. The active part is medical equipment, devices, equipment, tools for special purposes, on which the quality of medical care largely depends. The passive part is buildings and structures, communications, etc. Other fixed assets - soft inventory, household inventory, etc. In the structure of fixed assets of any institution, the passive part (about 75%) has the largest share, the active part is about 20%, and other fixed assets - about 5%. For economic analysis, the form of the annual report No. 5 "Movement of fixed assets" is required. Fixed assets are fixed assets in monetary terms, they are reflected in the balance sheet of fixed assets and in the balance sheet. The cost of fixed assets is taken into account in separate sub-accounts, which have a code: 010 - buildings, 011 - structures, 012 - transmission devices, 013 - machinery, equipment, 014 - linen, shoes and bedding, 015 - vehicles, 016 - production tools, including accessories and household equipment, etc. To determine the active part of fixed assets, it is necessary to sum up the cost of sub-accounts 013 and 016. In health care, the norm of the active part of fixed assets should be at least 20%. Fixed assets in health care are credited to the balance sheet of a health care institution at their full initial cost, which consists of the costs of acquisition, transportation, installation, etc. To analyze the use of fixed assets of a medical institution, the following key indicators are calculated. The capital-labor ratio of personnel labor is an indicator that characterizes the level of technical equipment of labor processes, the amount of fixed production assets per employee. Increasing the capital-labor ratio is one of the most important factors in improving the efficiency of work and the quality of medical care. The capital-labor ratio is determined by dividing the value of fixed assets by the average annual number of employees on the staffing table (medical, pharmaceutical and other personnel). Capital-labor ratio of personnel: cost of fixed assets / average annual number of employees. The capital-labor ratio of medical personnel is the active part of fixed assets is determined by dividing the value of the active part of fixed assets by the average annual number of medical personnel (doctors and nurses). Capital-labor ratio of medical staff: the cost of the active part of fixed assets / the average annual number of medical staff. Example. В hospital cost of fixed assets - 3250 c.u. e., the active part - 310,2 c.u. e. The average annual number of staff is 458 people, including 75 doctors and 250 paramedical workers. The capital-labor ratio of personnel labor is 3250 c.u. e. / 458 \u7,1d XNUMX y. e. The capital-labor ratio of the medical staff is 310,2 c.u. e. / 325 \u0,9d \u1d XNUMX y. e. (XNUMX c. e.) The effectiveness of the use of fixed assets characterizes the rate of return on assets. Return on assets - the volume of production per unit cost of fixed assets. This is a general indicator of the efficiency of reproduction and use of fixed production assets. The return on assets depends on the calendar time of using the fixed assets of the medical institution, the average number of bed occupancy per year and the number of days the polyclinic operates. The intensity of their use is important (turnover of beds in a hospital, reduction in the average duration of treatment in a hospital and clinic, rational organization of the work of medical personnel). Return on assets can be expressed both in kind and in value terms. The indicator is determined separately for the clinic and hospital. In physical terms, capital productivity is determined by the ratio of the number of hospitalized patients per year per 1000 rubles. fixed assets (according to the hospital) and the number of people who actually applied to the clinic for 1000 rubles. fixed assets (according to the polyclinic). Capital productivity for the hospital: number of hospitalized patients x 1000 / cost of fixed assets for a hospital (rubles). Return on assets for the clinic: number of applicants x 1000 / cost of fixed assets for the polyclinic (rubles). Calculation of return on assets in value terms is carried out by determining the amount of current costs for the maintenance of the institution, attributable to 1000 rubles. fixed assets. Capital productivity for the hospital: costs of maintaining a hospital x 1000 / cost of fixed assets for a hospital (rubles). Return on assets for the clinic: polyclinic maintenance costs x 1000 / cost of fixed assets for the polyclinic (rubles). When analyzing the work of a united hospital, capital productivity in terms of value can be presented as a whole for the institution, i.e., in the sum of data for the hospital and polyclinic. When analyzing capital productivity indicators, it should be borne in mind that their sharp increase may be due to hospital overload (i.e., the average bed occupancy exceeds the number of calendar days per year) or to the polyclinic's excessive load. Such an increase in capital productivity cannot be assessed positively. Capital intensity - the cost of fixed assets per unit volume of production. This is the reciprocal of the return on assets: the higher the return on assets, the lower the capital intensity, ceteris paribus, and vice versa. Distinguish between direct and full capital intensity. Direct capital intensity is defined as the ratio of the fixed assets of a healthcare institution to the volume of production in monetary terms. Full capital intensity takes into account not only fixed assets directly involved in the production of industry products (health care institutions), but also those that functioned in industries that indirectly participated in the production of these products. The capital intensity is determined by the ratio of the cost of the fixed assets of the hospital per 1000 hospitalized patients or the cost of the fixed assets of the polyclinic per 1000 who applied to the polyclinic. In value terms, capital intensity means the amount of fixed assets per ruble of costs incurred. Capital intensity by hospital: fixed assets of the polyclinic (rubles) x 1000 / number of hospitalized patients. Return on assets for the clinic: fixed assets of the polyclinic (rubles) x 1000 / number of people who applied to the polyclinic. 3. Indicators recommended for conducting an analysis of the economic activity of a polyclinic Efficiency (Eф), or the ratio of results to costs, is calculated using the following formulas: Эф = profit x 100 / cost = %, where profit = revenue - costs, the cost is equal to the costs incurred in the provision of medical care (the total cost of all paid services). The cost price reflects the costs incurred in the provision of services on a paid basis. Or Эф = gross income x 100 / cost, where gross income as a result of paid activities is equal to the sum of wages and profits. Performance efficiency is considered, as a rule, taking into account the cost, expressed as the total cost of not one, but all paid services, and the profit received as a result of all paid activities. Gross profit (ATп): turnover (revenue) - the cost of purchased raw materials, materials, other costs. Conditionally net profit: (ATп) - (overhead costs and amounts of depreciation of equipment). Revenue from the sale of medical services is calculated by multiplying the price of one service by their number. Since the services are different both in terms of prices and quantity, the sum sign (Σ) is used in the formula: Q = Σx(P xN), where Q - revenue, i.e. the volume of paid medical services in rubles, the turnover of the institution; P - the price of one service; N - the number of services of this type. Labor efficiency - labor productivity (Pт) employees: Пт = net profit (NP) x 100 / average number of employees, where net profit (NP) - profit after tax and interest on the loan. From the state of emergency, a production development fund, a social development fund, a material incentive fund, a reserve fund, i.e., accumulation and consumption funds, can be formed; average number of employees - the arithmetic average for 12 months the number of employees. The efficiency of labor costs shows the productivity of labor. Efficiency of use of material resources (medicines, soft materials, etc.) expresses material consumption (Mе), or the efficiency of the use of material resources (medicines, dressings, etc.): Ме \uXNUMXd material costs (M) / net profit (after the sale of services). Profitability (Rт), or profitability, profitability: Рт = net profit (NP) x 100 / book value of fixed and working assets =%, where Pт - profitability (should not be lower than 8 - 10%). Рт - the expression of profit in relative terms, as a rule, is calculated as the expected profit when calculating the price of medical services. In Moscow, for example, Rt equal to 20% is laid down. An indicator of growth in the efficiency of activities can also be a tendency to reduce costs per unit of service, i.e. average cost indicator (Cи): Си = gross costs (Bи) / number of services (Kу), where inи - the sum of all costs incurred by the polyclinic in the organization and implementation of medical care on a paid basis; K - all medical services for the reporting period. If withи" tend to decrease from one period to another, this indicates an increase in the efficiency of the commercial activities of health facilities. Conditionally fixed costs are considered to be the total value of which is unchanged per one workplace, does not depend on the volume of services rendered. These are the guaranteed level of staff remuneration, the cost of heating the building, lighting, overhead costs and other costs that do not depend on the number of visits to the clinic, the services provided, etc. However, these costs vary greatly per unit of service. used to characterize funding. indicator of the specific weight of the source of financing (in %): Пт = amount of a specific source of funding (budget, CHI, etc.) x 100/sum of all funding sources. The following indicators may also be included in the composition of indicators characterizing the economic activity of a polyclinic. Revenue per doctor: revenue / average annual number of doctors. The growth of this indicator can be, as a rule, due to an increase in the number of requests and affordable prices for medical services. Revenue per one attached: revenue / number attached. Average cost per visit calculated by the formula: Average cost per visit = sum of outpatient clinic expenses / number of visits. 4. Renovation of fixed assets Fixed assets reflect the state of the material and technical base of a healthcare institution (polyclinic, hospital, etc.). The renewal of fixed assets is characterized by 3 indicators: 1) retirement rate; 2) renewal factor; 3) accumulation coefficient. The retirement ratio characterizes the intensity of retirement of fixed assets for the year (rubles) to the value of fixed assets at the end of the year. Retirement ratio = amount of retired fixed assets for the year (rubles) / cost of fixed assets at the end of the year (rubles). The renewal coefficient shows the share of the value of new fixed assets that came into operation in a given year to their total value at the beginning of the year: Renewal coefficient = amount of introduced fixed assets for the year (rubles) / value of fixed assets at the beginning of the year (rubles). The standard for the renewal of fixed assets is 10 - 15%. The accumulation coefficient characterizes the process of replenishing the fixed assets of the institution: Accumulation coefficient = difference between the amount of introduction and retirement of fixed assets for the year (rubles) / cost of fixed assets at the beginning of the year (rubles). The profitability of fixed assets is the ratio of profit (the amount of self-supporting income in rubles) to the average annual cost in rubles, expressed as a percentage: Profitability \uXNUMXd profit (the amount of self-supporting income in rubles) / the average annual cost of fixed assets (rubles). Labor productivity (rubles) = income from the sale of medical services / the number of employees who participated in obtaining this income. 5. Analysis of the effectiveness of the use of the final fund Hospitals are the most expensive healthcare facilities, so the rational use of the bed fund is of great importance. Bed idling in hospitals not only reduces the volume of inpatient care and worsens the health care of the population as a whole, but also causes significant economic losses, since the cost of maintaining a hospital bed also occurs when the beds are not functioning. The cost of an empty bed is 2/3 of the cost of maintaining an occupied bed. The lower cost per bed day is in those hospitals where the bed capacity is used most intensively. Reducing bed downtime reduces overhead costs for hospitals and reduces the cost of their bed day. The main reasons for bed downtime are the lack of uniform admission of patients, "truancy" of the bed between discharge and admission of patients, preventive disinfection, quarantine due to nosocomial infection, repairs, etc. The efficiency of using the hospital bed fund is characterized by the following main indicators: the turnover of a hospital bed, the average annual occupancy (work) of a bed, the average downtime of beds, the implementation of the plan for hospital stays, the average duration of a patient's stay in a hospital. The data necessary for calculating the indicators can be obtained from the "Report of the medical institution" (form No. 30-zdrav.) and the "Sheet for registering the movement of patients and hospital beds" (form No. 007 - y). Hospital bed turnover defined as a ratio: number of discharged patients (discharged + deceased) / average annual number of beds. When calculating all indicators, the bed capacity of the hospital should be taken as the average annual number of beds. This indicator characterizes the number of patients who were in a hospital bed during the year. In accordance with the planned standards for city hospitals, it should be considered optimal within 17 - 20. The ability to serve one or another number of patients with one bed is determined hospital bed function (F), which is calculated as the quotient of the average annual bed occupancy, taking into account its profile (D), divided by the average number of days the patient stays in a bed of the same profile (P). F = D / P. For example, the the average occupancy of a maternity bed (according to the standard) is 280 days, the average length of stay in a maternity bed according to the standard is 9,1 days. The function of the obstetric bed is: F = D / P = 280 days / 9,1 days = 30,8 (31). This means that an obstetric bed can serve 31 pregnant women during the year. Average annual employment (work) of a hospital bed (actual employment) is calculated: number of bed days actually spent by patients in the hospital / average annual number of beds. The assessment of this indicator is carried out by comparison with the calculated standards. They are established separately for urban and rural hospitals with the specification of this indicator for various specialties. The optimal average annual bed occupancy can be calculated for each hospital separately, taking into account its bed capacity using the following formula:  where D is the average number of days a bed works in a year; H is the average annual number of beds in a hospital. For example, the for a hospital with 250 beds, the optimal bed occupancy per year will be:  This indicator is used in determining the estimated cost per day. The average annual bed occupancy may be reduced due to forced downtime of beds (for example, due to repairs, quarantine, etc.). In order to exclude the cause of underutilization of the bed fund in such cases, the indicator of the operation of a functioning bed is calculated, i.e., with the exception of downtime days. The calculation is made according to the following method: 1) the average number of beds closed during the year due to repairs is calculated: number of days of closure for repairs / number of calendar days per year; 2) the average number of beds that functioned during the year is determined: average annual number of beds - the number of beds that were closed due to repairs. The average number of days of work of a bed per year, taking into account repairs, is calculated: the number of bed days actually spent by patients / the number of beds that functioned during the year (not closed for repairs). Example. В the hospital has 50 beds, the number of bed days actually spent by patients was 1250, the number of bed days of closure for repairs was 4380. It is necessary to determine the average annual bed occupancy, taking into account the repair: 1) average number of beds closed due to renovation: 4380 k / day / 365 = 12 beds; 2) the average number of beds that functioned during the year: 50 beds - 12 beds = 38 beds; 3) average annual occupancy of a functioning bed (including repairs) 1250 k/d / 38 beds = 329 days. Thus, if repair days were not taken into account, the average annual bed occupancy would be only 250 days (1250 k/day / 50 beds = = 250 days), which would indicate a large underutilization of hospital beds. The average bed downtime (due to turnover) is the time of "truancy" from the moment the bed is vacated by the discharged patients until it is occupied by the newly admitted patients. T \u365d (XNUMX - D) / F, where T is the idle time of a bed of a given profile due to turnover; D - the actual average annual occupancy of a bed of a given profile; Ф - bed turnover. Example. The average downtime of a therapeutic hospital bed due to turnover with an average annual occupancy of 330 days and an average length of stay in a bed of 17,9 days will be: F \u330d D / P \u17,9d 18,4 days / XNUMX days \uXNUMXd XNUMX. T \u365d (365 - D) / F \u330d (18,4 - 1,9) / XNUMX \uXNUMXd XNUMX days. A simple bed more than this standard causes economic damage. If the downtime is less than the standard (and with a very high average annual bed occupancy, T can take a negative value), this indicates an overload of the hospital and a violation of the sanitary regime of the bed. Methodology for calculating economic losses from idle beds Economic losses as a result of idle beds are calculated on the basis of determining the difference between the estimated and actual cost of one bed day. The cost of a hospital day is calculated by dividing the cost of maintaining a hospital by the corresponding number of hospital days (estimated and actual). This excludes the cost of food for patients and the purchase of medicines, which do not affect the amount of losses from idle beds, since they are made only for the bed occupied by the patient. Estimated number of bed days is calculated based on the optimal average annual bed occupancy. Example. It is necessary to determine the economic losses from idle beds in a children's hospital with a capacity of 170 beds, if the average annual bed occupancy was 310 days, and the cost of the hospital was 280 USD. e. 1. Determine the number of hospital days actually spent by patients: Кф = 170 beds x 310 days = 52 k/d Actual cost of one hospital day = hospital expenses (without food and medicines) / Kф = 280 000 c.u. e. / 52 k / day \u700d 5,3 c.u. e. 2. Determine the estimated planned number of bed days (Kф): Кф = 170 beds x 340 days (optimum occupancy) = 57 k/d. Planned cost: estimated cost of one hospital day = hospital expenses (without food and medicines) / Cf. 3. The difference between the actual and planned cost of one day was: 5,3 at. e. - 4,8 y. e. \u0,5d XNUMX y. e. 4. We determine the economic losses from idle beds: 0,5 cu. e. x 52 k / day \u700d 26 c.u. e. Thus, as a result of idle beds, the hospital suffered losses in the amount of CU 26. e. Implementation of the plan for hospital stays defined like this: number of actual hospital days spent by patients x 100 / planned number of hospital days. The planned number of bed days per year is determined by multiplying the average annual number of beds by the standard bed occupancy per year. Analysis of the implementation of the planned indicators of the work of the bed for the year is of great importance for the economic characteristics of the activities of hospitals. Methodology for calculating economic losses from underfulfillment of the plan of coykodays Economic losses associated with underfulfillment by the hospital of the plan for bed days (Uс), are calculated by the formula: Ус = (B - PM) x (1 - (Kф / TOп)), where B - costs according to the estimate for the maintenance of the hospital; PM - the amount of expenses for food of patients and medicines; Кп - planned number of hospital days; Кф - the actual number of bed-days. For simplified calculations, Vc can be calculated as follows: Ус \u0,75d 1 x B x (XNUMX - (Kф / TOп)), where 0,75 is a coefficient reflecting the average ratio of the cost of an empty bed compared to the cost of an occupied bed. Example. Budget expenditures for a hospital with a capacity of 150 beds are 4 USD. e., including the cost of food and medicines - 000 c.u. e. The average annual bed occupancy according to the standard is 000 days, in fact, 1 bed was occupied for 000 days. Determine the economic losses associated with the underfulfillment of the plan of coykodays. 1. We determine the planned (Kp) and actual (Kf) number of bed days: Kp \u150d 330 beds x 49 days \u500d XNUMX k / day, Kf \u150d 320 beds x 48 days \u000d XNUMX k / day. 2. Determine the proportion of underfulfillment of the plan: Kf / Kp \u48d 000 k / day / 49 k / day \u500d 0,97. 3. We calculate the economic losses due to the underfulfillment by the hospital of the plan for hospital stays: Ус \u4d (000 c.u. - 000 c.u.) x (1 - 000) \u000d 1 x 0,97 \u3d 000 c.u. e. or simplified: Us = 4 c.u. e. x 000 x 000 y. e. = 0,75 0,03 c.u. e. Thus, due to the underfulfillment of the plan for one day, the hospital suffered economic losses in the amount of 90 USD. e. Average length of stay of a patient in a hospital (average bed day) is defined as the following ratio: the number of hospital days spent by patients in the hospital / the number of discharged patients (discharged + deceased). The average bed day ranges from 17 to 19 days (see Appendix). The value of this indicator depends on the type and profile of the hospital, the organization of the hospital, the severity of the disease and the quality of the treatment and diagnostic process. The average bed day indicates room for improvement in the use of the bed fund. With a decrease in the average duration of a patient's stay in a bed, the cost of treatment decreases, while a reduction in the duration of treatment allows hospitals to provide inpatient care to a larger number of patients with the same amount of budget allocations. In this case, public funds are used more efficiently (the so-called conditional budget savings). It can be calculated using the formula: E \uXNUMXd B / Kp x (Pr - Pf) x A, where E - conditional savings of budgetary funds; B - expenses according to the estimate for the maintenance of the hospital; Кп - planned number of bed days; Pr - estimated average length of stay in a hospital (standard); Pf - the actual average length of stay in the hospital; A is the number of patients treated in the hospital per year. Example. Budget expenditures for the maintenance of a therapeutic hospital with a capacity of 150 beds amounted to 4 USD. That is, the average annual bed occupancy according to the standard is 000 days. The estimated average duration of a patient's stay in a therapeutic bed is 000 days, the actual one is 320 days. The number of patients treated in the hospital for the year is 17,9. Calculate the conditional savings of budgetary funds from reducing the duration of treatment. 1. Determine the planned number of bed days: Kp \u150d 330 beds x 49 days \u500d XNUMX k / day. 2. Calculate the conditional savings of budget funds: E \u4d (000 c.u. / 000 k / day) x (49 - 500) x 17,9 \u15,2d 2260 x 80,8 x 2,7 \u2260d 493 c.u. e. Thus, the reduction in the average terms of treatment of patients in a therapeutic hospital for the year made it possible to reduce the cost of maintaining a hospital by 493 c.u. e. 6. Analysis of the effectiveness of the use of medical equipment Under the conditions of insurance medicine, the technical re-equipment of medical institutions with medical equipment began. Taking into account the high cost of medical equipment, especially imported, there was a need for an economic analysis of its effective use. For this purpose, the following indicators are calculated. Calendar service factor: time of possible use of medical equipment in accordance with the working hours of the medical facility / number of calendar days per year (365) x maximum possible working time per day (8 hours), the average standard is 0,9. Change factor: the number of actual hours of medical equipment operation per year / the number of maximum possible hours of medical equipment operation (according to equipment passport data) per year, the average standard is 0,6. Example. Determine the coefficient of calendar maintenance and the coefficient of turnover for a medical device for ultrasound examination (ultrasound), which has the maximum possible work time (according to the passport) - 8 hours, and the actual work time - 4 hours. Calendar service factor = 8 hours x 283 working days per year / 365 = 0,77. turnover rate = 4 hours x283 working days per year / 8 hours x 365 days = 0,38. 7. Analysis of the financial costs of health care institutions Analysis of financial costs is one of the important sections of the economic analysis of the activities of health care institutions. These indicators include: 1) the structure of financial expenses for the institution; 2) the cost of treatment in a hospital; 3) the cost of medical services in outpatient clinics. The last two indicators are discussed in the respective sections. Methodology for calculating indicators Share of salary costs by institution (%). Determination of costs is carried out by analyzing primary expenditure documents. Most of the cost in the budget is wages. Payroll costs are determined on the basis of monthly payrolls. Share of payroll costs: amount of salary costs for the year x 100 / total expenses for the institution as a whole for the year. The share of expenditures on wages in healthcare institutions is up to 55%, in the conditions of insurance medicine, this part of the expenditures can increase up to 70%. Actual expenses for individual budget items are accounted for in the same way as payroll expenses. The share of expenses for food of patients: Expenses for medical facilities for food for patients x 100 / the amount of expenses for the institution as a whole for the year. The share of these expenses is about 9%. Share of spending on medicines: facility spending on medicines x 100 / total facility spending for the year. This figure is about 10%. The share of equipment costs: equipment costs for the year x 100 / facility-wide costs for the year. The share of expenses for capital repairs: capital repair costs per year x 100 / the amount of expenses for the institution as a whole for the year. The average is 3,5%. This does not correspond to the real need, which leads to wear and tear of buildings and structures. 8. Analysis of the use of medical personnel Determining the indicators of the provision of the population with medical personnel, we assess the available opportunities for providing medical care. Quantitative indicators of the consumption of health services, when supplemented and compared with data on the effectiveness of services, can reveal shortcomings and, conversely, excessive consumption of medical care when it is not necessary. Increasing attention to the rational use of medical personnel allows for a relative reduction in health care costs. To analyze the effectiveness of the use of medical personnel of a medical institution, the following indicators are calculated. Number of medical workers in the polyclinic per 1000 inhabitants = number of medical staff x 1000 / average population. Similarly, the indicators of the number of doctors and paramedical personnel per 1000 inhabitants of a given territory are calculated. The indicator of the ratio of the number of doctors and paramedical workers = number of medical staff x 1000 / average annual number of nurses. Similarly, the ratio of the number of doctors and paramedical personnel for a hospital is determined. Number of all health workers per 100 beds =number of medical workers in hospital x 100 / / average annual number of hospital beds. Number of doctors per 100 hospital beds = number of hospital doctors x 100 / average annual number of hospital beds. Number of nurses per 100 hospital beds =number of nurses x 100 / average annual number of hospital beds. Indicators of the economic analysis of the activities of a medical institution must be compared in dynamics over several years, as well as with indicators of similar institutions. 9. Total economic loss due to morbidity, disability and mortality Disability due to morbidity, disability, and premature death cause significant economic damage to the national economy. A sick worker does not participate in social production and, consequently, in the creation of national income. In addition, during the period of incapacity for work, an allowance is paid and funds are spent on treatment. Thus, economic losses due to temporary and permanent disability are made up of the following components: 1) the cost of uncreated products, which is due to the loss of working time and a decrease in the number of workers, taking into account the average national income produced by one worker in one working day; 2) payment of benefits for temporary and permanent disability at the expense of social insurance and social protection funds; 3) funds spent on all types of medical care. The calculation of the cost of medical care is carried out by summing up: 1) the cost of outpatient, inpatient, paraclinical and sanatorium care; 2) the cost of ambulance and emergency care, delivery of the patient on vehicles to the hospital; 3) the cost of epidemiological care for infectious diseases. Data on the cost of medical care used in the calculations are expressed in conventional units (c.u.): 1) the cost of one medical visit to any specialist in a polyclinic is on average 10 USD. e.; 2) the cost of one clinical diagnostic study in a polyclinic is on average 5 c.u. e.; 3) the cost of staying for one day in the hospital is 50 USD on average. e.; 4) the amount of daily allowance for temporary disability is on average 15 c.u. e.; 5) the value of the national income produced by one worker per day is on average 70 c.u. e.; 6) the amount of national income produced by one worker per year is on average 15 c.u. e.; 7) the monthly disability pension (regardless of disability group) averages 200 c.u. e.; 8) the total cost of a voucher to a sanatorium of any profile is on average 3000 USD. e. The cost of outpatient care is the sum of the cost of all: 1) visits to doctors (including professional examinations) in the clinic and at home; 2) diagnostic studies; 3) medical manipulations and procedures. Example. Patient D. with a diagnosis of "pneumonia" was visited 4 times by a local therapist at home, 3 visits to the clinic and 2 consultations of a pulmonologist were made. During the period of the disease, 3 blood tests, 2 urine tests, twice - chest X-ray, ECG, as well as 14 injections and 7 electrophoresis sessions were made. The estimated cost of one medical visit to a specialist of any profile in a polyclinic and at home is an average of $10. e. The cost of one clinical and diagnostic study, medical and physiotherapy procedures - 5 c.u. e. Thus, the cost of treating patient D. with a diagnosis of pneumonia will be the sum of the cost of all visits to doctors, all paraclinical examinations, physiotherapy and injections, which will be: 10 at. e. x 9 visits + 5 c.u. e. x 8 research + 5 c.u. e. x 7 physiotherapy + 5 c.u. e. x 14 injections = 235 y. e. The cost of inpatient care is determined taking into account the cost of one hospital day and the length of stay in the hospital. Example. Patient S. with a diagnosis of rheumatism spent 28 days in the hospital. Considering that the cost of staying for one day in a hospital is on average 50 USD. That is, inpatient care for this patient is assessed as follows: 50 at. e. x 28 days = 1400 c.u. e. The cost of sanatorium treatment is determined by the amount of funds allocated from the social insurance fund. If the voucher is free, then the cost of treatment is equal to the full cost of the voucher, if the voucher is preferential - the amount received from social insurance funds (as a rule, from 70 to 90% of the cost of the voucher). Example. Patient P. with a diagnosis of "chronic gastritis" received a preferential 10% ticket to a gastroenterological sanatorium. The total cost of the ticket is 3000 USD. e. Therefore, 90%, i.e. 2700 c.u. e., paid for by social security. This is the cost of spa treatment for this patient. Thus, the total cost of medical care for one patient or group of patients is determined by summing up all components of the cost of medical services. The calculation of losses associated with the payment of temporary disability benefits is made taking into account the average daily allowance and the number of missed working days. Losses in the value of uncreated products are defined as the result of multiplying the average national income produced by one worker in one working day by the number of days missed due to illness. In the examples below, the values of the daily allowance for temporary disability and the national income produced by one worker per day are taken without regard to specialty, position, work experience, wages and are conditionally average. In addition, for educational purposes, calculations are made taking into account all days missed due to illness, including weekends, while in practice only working days are taken into account. Example. The duration of disability technologist N. diagnosed with "gastric ulcer" was 44 days. Of these, he was treated on an outpatient basis for 6 days (3 visits to the doctor, 5 clinical diagnostic studies were made), then he was in the hospital for 28 days. After being discharged, he was observed by a polyclinic doctor for 10 days (3 visits), and then he received a preferential ticket to a sanatorium and spent 24 days there, using his next vacation. The total economic damage due to the disease of the patient N. is calculated by adding the following values: 1) loss of value of uncreated products due to a decrease in the number of days of work (the average national income per day per worker is 70 cu, see the appendix): 70 at. e. x 44 days = 3080 c.u. e.; 2) the amount of temporary disability benefits (the average daily allowance for temporary disability is 15 c.u.): 15 at. e. x 44 days = 660 c.u. e.; 3) treatment costs: 10 at. e. x 6 visits to the doctor + 5 c.u. e. x 5 studies (cost of outpatient treatment) + 50 c.u. e. x 28 days (cost of inpatient treatment) + 2100 c.u. e. (the cost of spa treatment) = 3585 c.u. e. Thus, the total economic damage due to the disease of patient N. was: 3080 at. e. + 660 c.u. e. + 3585 c.u. e. = 7325 c.u. e. Example. Engineer Z.'s 3-year-old daughter fell ill with acute bronchitis. For the period of caring for her, the mother was issued a certificate of incapacity for work for 6 days. During the illness, there were 20 visits to the district pediatrician, 7 clinical diagnostic studies, 5 injections, 12 UHF sessions were made. The total economic damage due to the child's illness in this case is calculated by adding: 1) the cost of outpatient treatment: 10 c.u. e. x x 7 visits + 5 y. e. x 5 research + 5 c.u. e. x 12 injections + 5 y. e. x 6 physiotherapy = 185 c.u. e.; 2) losses in the value of uncreated products due to a decrease in the number of days the mother works: 70 c.u. e. x 20 days = 1400 c.u. e.; 3) the amount of temporary disability benefits in connection with caring for a sick child: 15 c.u. e. x 20 days = 300 c.u. e. Consequently, the total economic damage due to the illness of this child will be: 185 c.u. e. + 1400 c.u. e. + 300 c.u. e. = 1885 c.u. e. Example. Worker V. had a 15-year-old son in hospital for 5 days with a diagnosis of "closed craniocerebral injury, concussion." For the entire period of hospitalization, by decision of the EEC, the mother was issued a certificate of incapacity for work to care for a sick child. In this example, the total economic loss due to a child's illness is the sum of: 1) loss of value of uncreated products due to the absence of the mother at work: 70 at. e. x 15 days = 1050 c.u. e.; 2) the amount of temporary disability benefits in connection with caring for a sick child: 15 c.u. e. x 15 days = 225 c.u. e.; 3) the cost of inpatient treatment of the child: 50 c.u. e. x 15 days = 750 c.u. e. The amount of damage in this case will be: 10 50 USD. e. + 22 5 c.u. e. + 750 c.u. e. = 2025 c.u. e. The economic damage due to disability consists of funds spent on treatment and payment of disability pensions, and losses in the value of uncreated products due to a decrease in the number of people employed in production activities. In addition, the non-participation of disabled people (mainly groups I and II) in subsequent labor activity is of great importance, in connection with which, when calculating the economic damage, one should also take into account a period equal to the duration of the remaining working period of their life (until they reach the age that gives them the right to receipt of an old-age pension: for women - 55 years, for men - 60 years). Example. Worker T., who had a myocardial infarction, has been an invalid of group II for 10 months (240 days). The monthly disability allowance is $200. e. The cost of treatment for this period amounted to 3000 c.u. e. The total economic damage in this case consists of: 1) loss of value of uncreated products due to disability: 70 c.u. e. x 240 working days = 16 c.u. e.; 2) disability pension payments: 200 c.u. e. x 10 months = = 2000 c.u. e.; 3) treatment costs - 3000 c.u. e. The amount of damage in this case will be $21. e. Example. Lineman R., aged 32, was seriously injured, which resulted in the amputation of both legs. In this regard, he was given a disability of group I for life and was assigned a pension of 200 c.u. e. Economic damage due to the termination of labor activity earlier established by the legislation, taking into account the annual pension (200 cu x 12 months = 2400 cu), unpaid national income per employee per year (15 cu, see. application) and the number of years not completed before retirement (000 years) will be: 28 c.u. e. x 2400 years old + 28 c.u. e. x 15 years \u000d 28 c.u. e. A similar method is used to determine the amount of economic damage due to premature death. Example. Climber L., aged 23, died during a training camp. The economic loss due to premature death is calculated as follows: 15 000 c.u. e. (average annual uncreated national income) x 32 years (number of years until retirement age) = 480 c.u. e. Example. Schoolboy 3., aged 10, was hit by a bus and died as a result. In this example, the amount of economic damage due to premature death is calculated taking into account the fact that labor activity begins at the age of 18 and will be: 15 000 c.u. e. (average annual uncreated national income) x 42 years (number of years until estimated retirement) = 630 c.u. e. 10. Prevented economic damage The economic efficiency of health care is determined not only by the amount of economic damage from certain cases of morbidity, disability, disability associated with social causes, but also by the reduction of this damage as a result of a complex of therapeutic and preventive measures aimed at eliminating morbidity and mortality (introduction of new diagnostic methods and treatment, advanced training of doctors and paramedical personnel, etc.). In this case, we talk about the prevented economic damage, which consists of a decrease in the incidence and duration of temporary and permanent disability, mortality, as well as a decrease in the cost of medical care. The amount of prevented economic damage is determined for a patient or a group of patients who are under dispensary observation for a long time (at least 3 years), and is the difference between the economic damage of the first and each subsequent year. 11. The criterion of economic efficiency The criterion of economic efficiency is determined by dividing the amount of prevented economic damage by the amount of funds spent. Example. The economic damage due to the disease of the seamstress O., who suffers from chronic cholecystitis, in the first year of being taken to the dispensary account amounted to 7500 USD. e., in the second year - 5300 c.u. e., in the third year - 2600 c.u. e. The cost of medical care during the medical examination (3 years) amounted to 3000 c.u. e. The amount of prevented economic damage will be: for the first year: 7500 c.u. e. - 1500 c.u. e. = 6000 c.u. e.; for the second year: 7500 c.u. e. - 5300 c.u. e. = 2200 c.u. e.; for the third year: 7500 c.u. e. - 2600 c.u. e. = 4900 c.u. e.; Total for 3 years: 2200 c.u. e. + 4900 c.u. e. = 7100 c.u. e. The cost of medical care for this patient for this period amounted to 3000 USD. e., therefore: Criterion of economic efficiency = 7700 c.u. e. (amount of prevented economic damage) / 300 c.u. e. (cost of medical care) = 2,37. The result obtained means that the ratio of the cost of costs and the prevented economic damage is 1 / 2,37, i.e. 1 c.u. e. of the cost of medical care for this patient, an economic effect of 2,37 c.u. e. Author: Zhidkova O.I.
▪ Criminal process. Lecture notes
Artificial leather for touch emulation
15.04.2024 Petgugu Global cat litter
15.04.2024 The attractiveness of caring men
14.04.2024
▪ section of the site Your stories. Article selection ▪ article Transport aircraft Ruslan. History of invention and production ▪ article Why Brazilian football player Giovane Elber once taped his mouth shut? Detailed answer ▪ article The functional composition of Akira TVs. Directory ▪ article Simple watchdog bell. Encyclopedia of radio electronics and electrical engineering ▪ article Transformation of dominoes. Focus secret
Comments on the article: Vitaly Mikhailovich From the very first line you can see outright stupidity. It turns out that statistics is a social science that studies mass social phenomena. What about urine tests? Effects of various drugs, etc., etc. .... These data are no longer the object of statistical research? Medical statistics are not only health and healthcare statistics, although these things may be in the field of medical statistics. The final part "decorates" the presented nonsense. It is not at all clear here why the author calls the simple arithmetic of calculating conditional economic costs statistics. The author completely ignores the fact that statistics, as a science, studies phenomena that manifest themselves only in the mass of observations !!! It is impossible to call all numerical methods (for all their usefulness and significance) statistical. Victor Calculating the economic effect of treatment is a great way to resist the arbitrariness of illiterate officials to cut medical and preventive institutions, citing an unnecessary burden on the budget.
Home page | Library | Articles | Website map | Site Reviews
www.diagram.com.ua |


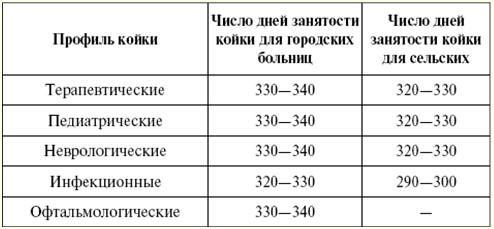

 See other articles Section