|
|


 Arabic
 Bengali
 Chinese
 English
 French
 German
 Hebrew
 Hindi
Hindi Italian
 Japanese
 Korean
 Malay
Malay Polish
 Portuguese
 Spanish
 Turkish
 Ukrainian
 Vietnamese
|
ENCYCLOPEDIA OF RADIO ELECTRONICS AND ELECTRICAL ENGINEERING Device for remote monitoring of the health of piezoelectric sensors
Encyclopedia of radio electronics and electrical engineering / Security devices and object signaling The danger of the consequences of an accident makes it necessary to impose increased requirements on the reliability of the measuring channel and, above all, the sensor, since it is operated in the most difficult conditions that exist at this facility. There is a need to control its properties as a means of measurement more often than is done with periodic (usually once a year) verification. Since the sensor is often installed in a hard-to-reach place (for example, under the casing of the unit), control must be carried out remotely. The control method [1], implemented in the described device and making it possible, is based on the fact that the piezoelectric transducer of the sensor is reversible, it generates an electrical signal when it is mechanically acted upon and experiences mechanical deformation when an electrical voltage is applied. In both cases, the level of response to the impact is determined by the same coefficient, called the piezo-modulus. The inertia of the sensor as a mechanical system is determined by the frequency of its free oscillations, which depends primarily on the properties of the sensor itself, but also on the mechanical properties of the part of the object in contact with the sensor. It is called the frequency of the installation resonance (UR). The electrical inertia is not related to the mechanical one and is determined in the first approximation by the product of the capacitance of the sensor with the cable and the active resistance of its load. The frequency spectrum of the vibration measured by the sensor always lies below the frequency of the SD (otherwise the measurement result will be unreliable), occupying, as a rule, the area from zero to 0,2...0,3 of its value. To connect to the described control device, the sensor is disconnected from the equipment with which it works. A constant voltage is applied to it, charging its capacitance and deforming the piezoelectric element. The duration of this operation should be such that all transient mechanical and electrical processes have time to end. After that, the voltage source is disconnected from the sensor and a small active resistance is connected to the terminals of the latter for a time (usually several tens of microseconds) sufficient for almost complete discharge of the sensor capacitance. The mechanical deformation of the piezoelectric element cannot change at the same rate, its return to the initial state occurs in the form of damped oscillations with the frequency SD. The piezoelectric element converts these oscillations into an electrical signal, which is recorded, for example, by a storage oscilloscope. A sign of the normal state of the sensor is the invariability of the shape and level of the signal during repeated monitoring. The main nodes of the control device are two single vibrators, which set the duration of the closing and registration intervals, and two switches. The excitation of oscillations by the decay of the pulse with a stable duration of the closure makes it possible to achieve good repeatability of the level and shape of the electrical signal, which is necessary for metrological operations. The described version of the device is somewhat more complicated. Since the storage oscilloscope is an expensive and relatively rare device, the control process is made cyclic, which made it possible to use a conventional oscilloscope. For greater reliability in determining the frequency of SD, a filter is introduced that suppresses high-frequency interference. There is an autonomous low-voltage power supply and a UR frequency meter with an LED indicator.
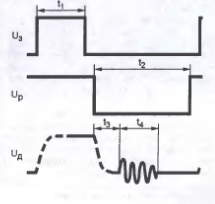
The scheme of the device is shown in fig. 1. The multivibrator on the elements DD1.1 and DD1.2 generates rectangular pulses. From the output of the element DD1.2, a pulse of duration t is fed to the control input of the switch DA1.3. During its operation, a charging voltage of +1 V is supplied through a closed switch to the input of the sensor connected to the X14 connector via the R15R3HL12 circuit (curve U3 in Fig. 2).
The capacitance of the sensor is charged up to this voltage. The HL3 LED is designed to signal a short circuit in the sensor circuit. The pulse, inverse with respect to the considered, comes from the output of the element DD1.1 through the differentiating (C2R6) and integrating (C4R11) circuits to the inputs of the element DD1.3. At its output, a low logic level pulse is formed, located in the pause between the charging pulses, but having a duration t2 shorter than the pause. Through the C6R18 differentiating circuit, the falling edge of this pulse triggers a single vibrator on the DA6 timer, the pulse of which, with a duration determined by the parameters of the R21C7 circuit (interval t3 in Fig. 2), is fed to the control input of the lower (according to the circuit) switch of the DA2 microcircuit. In this case, the sensor output (pin 3 of connector X1) is connected to a common wire through a switch and resistor R12, discharging the sensor capacitance. The voltage across the sensor (curve U in Fig. 2) decreases to zero. The falling edge of the timer pulse starts a single vibrator on the elements DD6.1 and DD6.3, generating a pulse of duration t4 (determined by the parameters of the C13R31R53 circuit) now oscillatory in nature, through the differentiating circuit C6.2R2 is fed to the input of the amplifier on the op-amp DA5, to the output of which, through the resistor R16, the switch SA4 is connected either to the capacitor C25 ("Indication" mode), or resistor R3 ("Diagnostic" mode). In the first case, a smoothing filter is formed, in the second - a frequency-independent voltage divider. Next, the signal goes to the X8 connector, to which an oscilloscope or other recorder is connected. A synchronization pulse is output to the same connector, coinciding in time with the beginning of the interval t27. The remaining nodes of the device form the UR frequency meter. The sensor signal with the help of amplifier DA3 and voltage comparator DA5 is converted into a series of pulses of standard amplitude. The gain (10 or 20) is selected by the switch SA2, the state of which is indicated by the LEDs HL1 and HL2. Counting the pulses from the output of the comparator for 1 ms would give the value of the frequency of the SD in kilohertz. However, this method turned out to be unacceptable, since the natural oscillations of modern piezoelectric sensors decay much faster. Therefore, it was necessary to count the pulses for several shorter intervals with a total duration of 1 ms. The experiment showed that two intervals of 500 μs are quite sufficient. The account proceeds as follows. After pressing the SB2 "Set. 0" button, the DD2.1 counter is set to the readiness state for counting, indicated by the HL4 "Ready" LED, and the counters DD4 and DD5 are set to zero. A long press on the SB1 "Start" button opens the switch DA1.1, and the clock pulses from the output of the element DD1.2 pass through the open switch DA1.2 to the counter DD2.1. Two inputs of the element DD3.2 signals come from the outputs 2 and 4 of the counter, and its third input - from the output of the element DD6.2. As a result, a high level at the output of the DD3.3 element exists only during the operating cycles following the sixth and seventh charging pulses (counting from the moment the SB1 button is pressed). The eighth pulse sets a high level at the output 8 of the counter DD2.1, which closes the switch DA3.1 through the inverter DD1.2. The receipt of pulses at the input of the counter DD2.1 stops, and the HL4 LED goes out. Now the SB1 button can be released. The output of the element DD3.3 is connected to the control input of the switch DA1.4, connected between the output of the comparator DA5 and the input of the counter DD4. The indication of the status of the counters DD4 and DD5 is not quite usual - using two ten-day lines of LEDs HL5-HL24. This was done to reduce the current consumption: the total consumption of all these LEDs in any case does not exceed 8 mA. Unfortunately, even more economical LCDs are not suitable due to the insufficient operating temperature range. Diodes VD1-VD3 introduced to reduce crosstalk. All capacitors in the device are ceramic, and C7 and C13 must have a small TKE, they can be different, for example, mica. Thermostable (for example, C2-31) should also be resistors R21 and R31. Switches - sliding small-sized B1561. However, instead of SA3, it is better to use a button with switching contacts, for example PS580N. The position of the contacts when the button is released must match that shown in the diagram in Fig. one. The type of connector X1 depends on which sensors are supposed to be checked most often. The author used a block plug RS-4TV, since the bulk of domestic industrial vibration sensors are piezoelectric accelerometers ABC and ANS with cable sockets RS-4TV, the purpose of the contacts of which corresponds to that shown in the diagram in Fig. 1. Since vibration resistance is not required from a detachable connection in this case, it is advisable to carefully remove the external thread on the plug body, which will facilitate and speed up the process of connecting and disconnecting sensors. Sensors of other types can be connected to the device through appropriate adapters. Connector X2 can be any, for example, ONTS-VG-2-3/16-p. The signal wire in the cable connected to it must be shielded, the clock signal wire does not require shielding.
The device is powered by a battery of five to six galvanic cells of size AA, the voltage of which is converted to a bipolar stabilized +/-12 V using a TMR0522 converter [2], connected according to the circuit shown in fig. 3. When the GB1 battery voltage is 7,5 V, the current consumed from it is 130 and 145 mA, respectively, in the "Diagnostics" and "Indication" modes. The device is assembled on two boards, one above the other and connected by ribbon cables. Controls and LEDs are mounted on the top board, and the rest of the elements are mounted on the bottom board, except for the connectors, which are located on a separate corner panel. The body is selected ready. Since most active elements are logic gates and op amps without external correction, setting up a properly wired device does not require much effort. After making sure that the multivibrator on the elements DD1.1, DD1.2 generates symmetrical rectangular pulses with a repetition rate of 30 ± 5 Hz, you need to check the position and shape of the pulses at the output of the element DD1.3.
In the absence of a two-beam oscilloscope, for this you can use the simplest adder, the circuit of which is shown in Fig. four.
The oscillogram of the signal at its output should have the form shown in Fig. 5, where t1 and t2 are the same intervals as in fig. 2. Selecting resistors R6 and R11, ensure that the interval t2 starts after 0,3 ... 1 ms after the end of the charging pulse. Its duration should be 5 ... 10 ms, the exact value is not important. The pulse generated by the DA6 timer must have a duration in the range of 20 ... 30 μs. But the pulse duration at the output of the DD6.2 element must be set with a trimming resistor R53 equal to 500 μs with the greatest possible accuracy. This directly affects the measurement error of the SD frequency.
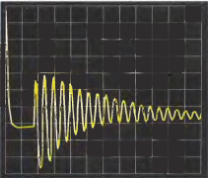
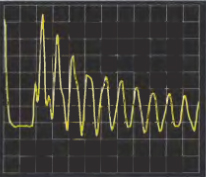
For further adjustment, a piezoelectric sensor (accelerometer) is required, preferably with a conversion coefficient of the order of millivolts per meter per second per second and a free oscillation frequency (it is higher than the SD frequency) of more than 10 kHz. By connecting the sensor to connector X1, the controls of the oscilloscope connected to connector X2 achieve a stable image on the screen, similar to that shown in Fig. 6-8. They show oscillograms illustrating the dependence of the signal on the state of the sensor: loose (Fig. 6); installed in strict accordance with the instruction manual (Fig. 7); installed, but with loose fastening to the controlled structure (Fig. 8). The scale of the oscillograms along the vertical and horizontal axes is 50 mV/div, respectively. and 50 µs/div. The repeatability of the excited oscillations is characterized by the results of measuring the position of the characteristic points of the oscillograms with a tenfold repetition of the excitation. The spread did not exceed 1,5% and practically coincided with the error of the S9-8 storage oscilloscope used. It is desirable to make sure that there is no signal distortion at the output of the op-amp DA3. In practice, they are unlikely, the range of damped oscillations of sensors of different types varies slightly and does not exceed several hundred millivolts. When checking the operation of the Schmitt trigger on the DA5 comparator, you should compare the number of signal periods at its input and output pulses. The trigger thresholds are set by a selection of resistors R19 and R23. The first control of the sensor, especially designed to work on a long-term and non-stop operating object, is desirable to carry out immediately after its installation. In this case, it will immediately become clear whether all requirements are met (permissible non-flatness and roughness of the seating surface, tightening torque of the thread, absence of contamination, etc.). Their violation can reduce the frequency of the SD so much that the sensor signal will not correctly reflect the nature of the vibration. As a result, it is possible to generate a false command for an emergency stop of the object. The result obtained (counting the frequency of the SD and the position of the switch SA2) is recorded; it will serve as the basis for assessing the state of the sensor during subsequent control cycles. The observed deviation will serve as the basis for a more detailed study of the condition of the sensor and a decision on the need to repair or replace it. This implies that the control is carried out on a stopped unit. Its temperature is not necessarily constant, and the effect used is sensitive to its change. As mentioned above, at both stages of the process of excitation of oscillations, the reactions to the impact are determined by the value of the piezoelectric modulus - the characteristics of the transducer material, which depends on the degree of orderliness of its microstructure, which decreases with increasing temperature. In this case, the amplitude of the electrical signal is proportional to the square of the piezoelectric modulus and its temperature dependence is correspondingly stronger. According to the experiment, the signal of the sensor with a maximum operating temperature of 250 °C during control at temperatures up to 120 °C had instability within ±6%. Therefore, it is desirable that in all control cycles the temperature spread does not exceed 20 °C. In this regard, it is better to operate the device in conjunction with a device that allows you to measure the temperature of the sensor. The possibility of carrying out control on the operating unit depends on a number of circumstances. We can immediately say that if the vibration level recorded by the sensor during normal operation of the object is close to the limit for the sensor, the upper limit of the vibration spectrum approaches the frequency of the SD, or, finally, the temperature of the sensor is close to the maximum allowable, control is impossible. You will have to carry it out during planned shutdowns of the unit, but even in this case, the use of the device will save time and get rid of mechanical work. If the circumstances listed above are not so obvious, control should be carried out before start-up and during operation of the facility. By comparing the results, you can make an informed decision. It must be borne in mind that control using only the built-in indicators of the described device implements only part of the possibilities. An analysis of the spectrum or other characteristics of the natural vibrations of the sensor will allow not only to more accurately assess its condition, but also to obtain additional information about the health of the node of the object on which the sensor is installed. The fact is that the upper limit of the spectrum of the sensor signal obtained during its normal operation, most often does not exceed 1000 Hz, and sometimes even lower. Small faults on the object have little effect on the nature of the vibration spectrum. And since the spectrum is incomparably wider during control, then, by analyzing it, it is possible to notice even small changes in the situation on the object, of course, if they occur close to the sensor. The spectrum analyzer is connected to the X2 connector instead of the oscilloscope (or together with it) and the SA3 switch is set to the "Diagnostics" position. The device makes it possible not only to detect the fact of a change in the sensor conversion coefficient caused by a change in the piezoelectric module, but also to calculate its new value. The simplest technique is to compare the signals during double control: first, immediately after the installation of the sensor, when the data of its recent verification are valid, and then after the time for which one can expect changes in the parameters of the sensor. On both records, you need to select N oscillation periods in the same way, in each of them determine the signal range (the difference between the maximum and minimum values) and sum the obtained values. If during the initial control the sum V1 was obtained, and during the repeated control - V2, the conversion coefficient at the time of the repeated control is equal to
where S1 is the value of the conversion coefficient obtained during verification [3]. It can be used in the analysis of measurement results up to the next standard verification. Another application of the device can be found in the manufacture of piezoelectric sensors at the stages of assembly and regulation of parameters. On the oscilloscope screen, you can observe the response of the sensor to ongoing operations as clearly as when setting filters with a sweeper. In this case, it is possible to obtain information not only about the resonance frequency, but to some extent also about the value of the conversion coefficient. We add that in addition to vibration sensors, it is possible in some cases to control piezoelectric pressure pulsation sensors, however, control will only be qualitative: according to the "good-failure" principle. Literature 1. Subbotin M. Method of electrical excitation of resonant oscillations of a piezoelectric accelerometer and a device for its implementation. Patent of the Russian Federation No. 2150708. - Bulletin of Inventions, 2000, No. 16.
Author: M. Subbotin, Moscow; Publication: radioradar.net
Artificial leather for touch emulation
15.04.2024 Petgugu Global cat litter
15.04.2024 The attractiveness of caring men
14.04.2024
▪ Miniature module for receiving digital radio broadcasts ▪ Blind Spot Monitoring in Mercedes-Benz Trucks ▪ A device that mimics the brain
▪ site section Chargers, accumulators, batteries. Article selection ▪ Article Planet Neptune. History and essence of scientific discovery ▪ article Who are the Neanderthals? Detailed answer
Home page | Library | Articles | Website map | Site Reviews
www.diagram.com.ua |


 Leave your comment on this article: